Download IITian Academy App for accessing Online Mock Tests and More..

Question
There are \(120\) teachers in a school. Their ages are represented by the cumulative frequency graph below.
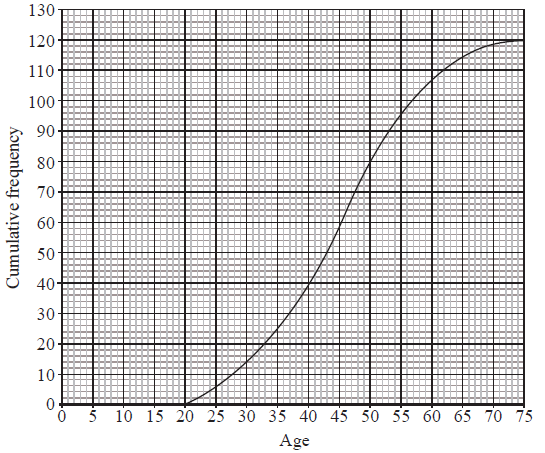
Write down the median age.[1]
Find the interquartile range for the ages.[2]
Given that the youngest teacher is \(21\) years old and the oldest is \(72\) years old, represent the information on a box and whisker plot using the scale below.
 [3]
[3]
Answer/Explanation
Markscheme
\({\text{Median }}= 45\) (A1) (C1)
Accept \(45.5\)[1 mark]
\(53 – 37\) for identifying correct quartiles (A1)
\( = 16\) for correct answer to subtraction (A1)(ft) (C2)
(ft) on their quartiles[2 marks]
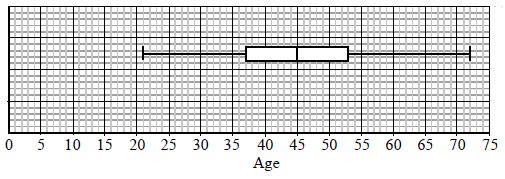
Median marked correctly. (A1)(ft)
Box with ends at candidate’s quartiles. (A1)(ft)
End points at \(21\) and \(72\) joined to box with straight lines. (A1) (C3)
Note: Award (A0) if lines go right through the box.[3 marks]
Question
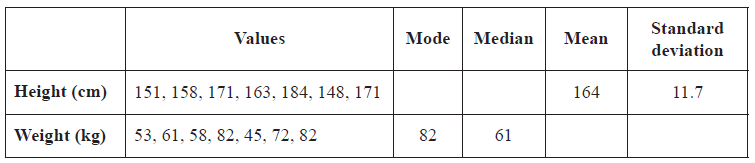
Complete the following table of values for the height and weight of seven students.
Answer/Explanation
Markscheme
\({\text{Mode}} = 171\) (A1)
\({\text{Median }}148{\text{, }}151{\text{, }}158{\text{, }}163{\text{, }}171{\text{, }}171{\text{, }}184\)
\( = 163\) (A1)
\({\text{Mean}} = 64.7\) (A1)
\({\text{Standard deviation}} = 13.3\) (A1) (C4)
Note: If both mean and standard deviation given to 2 significant figures
\({\text{Mean }}65\), (A0)(AP)
\({\text{Standard deviation }}13\) (A1)(ft) ((AP) already deducted).[4 marks]
Question
A survey was conducted of the number of bedrooms in \(208\) randomly chosen houses. The results are shown in the following table.
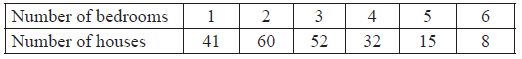
State whether the data is discrete or continuous.[1]
Write down the mean number of bedrooms per house.[2]
Write down the standard deviation of the number of bedrooms per house.[1]
Find how many houses have a number of bedrooms greater than one standard deviation above the mean.[2]
Answer/Explanation
Markscheme
Discrete (A1) (C1)[1 mark]
For attempting to find \(\sum fx/\sum f\) (M1)
\(2.73\) (A1) (C2)
Note: for (b) and (c), if both mean and standard deviation given to 2 significant figures.
Award (C1)(C0)(AP) for \(2.7\). Award (A1)(ft) for \(1.3\) ((AP) already deducted).[2 marks]
\(1.34\) (A1) (C1)
Note: for (b) and (c), if both mean and standard deviation given to 2 significant figures.
Award (C1)(C0)(AP) for \(2.7\). Award (A1)(ft) for \(1.3\) ((AP) already deducted).[1 mark]
Attempt to find their mean \( + \) their standard deviation (can be implied) (M1)
\(23\), (ft) their mean and standard deviation. (A1)(ft) (C2)[2 marks]
Question
A random sample of 200 females measured the length of their hair in cm. The results are displayed in the cumulative frequency curve below.
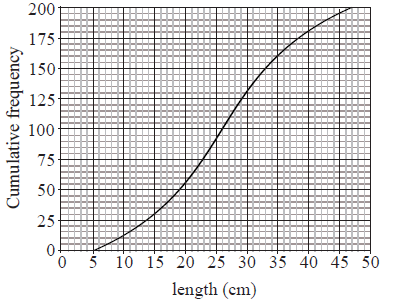
Write down the median length of hair in the sample.[1]
Find the interquartile range for the length of hair in the sample.[2]
Given that the shortest length was \(6{\text{ cm}}\) and the longest \(47{\text{ cm}}\), draw and label a box and whisker plot for the data on the grid provided below.
 [3]
[3]
Answer/Explanation
Markscheme
Unit penalty (UP) is applicable where indicated in the left hand column.
(UP) \(26{\text{cm}}\) (A1) (C1)[1 mark]
Unit penalty (UP) is applicable where indicated in the left hand column.
\(33 – 19\) for identifying correct quartiles. (A1)
(UP) \( = 14{\text{ cm}}\) . (A1)(ft) (C2)
Note: (ft) on their quartiles.[2 marks]
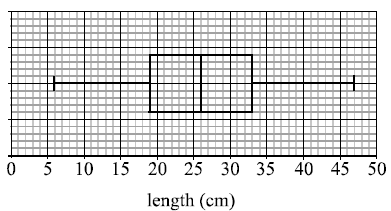
correct median (A1)(ft)
correct quartiles and box (A1)(ft)
endpoints at \(6\) and \(47\), joined to box by straight lines. (A1) (C3)[3 marks]
Question
The diagram below shows the cumulative frequency distribution of the heights in metres of \(600\) trees in a wood.
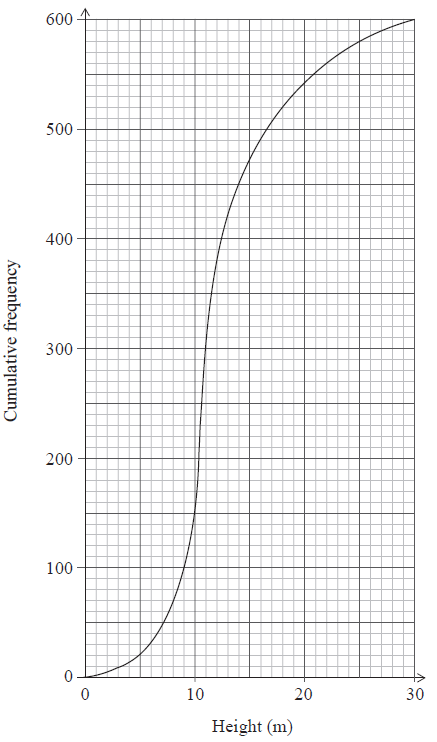
Write down the median height of the trees.[1]
Calculate the interquartile range of the heights of the trees.[2]
Given that the smallest tree in the wood is \(3{\text{ m}}\) high and the tallest tree is \(28{\text{ m}}\) high, draw the box and whisker plot on the grid below that shows the distribution of trees in the wood.
 [3]
[3]
Answer/Explanation
Markscheme
Median \( = 11{\text{ m}}\) (A1) (C1)
Note: Award A0 for “\(11\)” without units; correct units must be included for the A1 to be awarded.[1 mark]
\({\text{Interquartile range}} = 14 – 10\) (A1)
\( = 4\) (A1)(ft) (C2)
Note: (M1) for taking a sensible difference or for both correct quartile values seen.[2 marks]
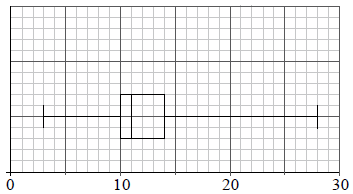
correct median (A1)(ft)
correct quartiles and box (A1)(ft)
endpoints at \(3\) and \(28\), joined to box by straight lines (A1) (C3)
Notes: Award (A0) if the lines go right through the box. Award final (A1) if the whisker goes to \(20\) with an outlier at \(28\).[3 marks]
Question
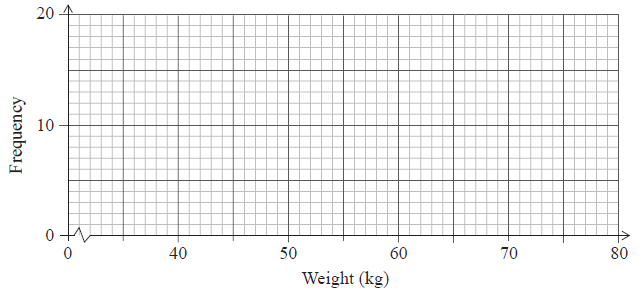
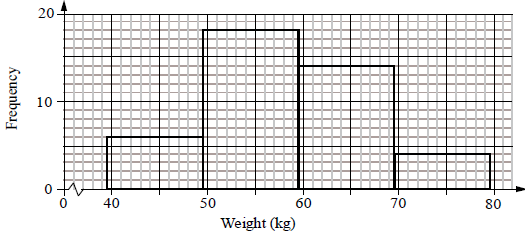
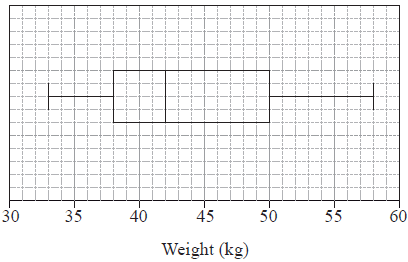
The distribution of the weights, correct to the nearest kilogram, of the members of a football club is shown in the following table.
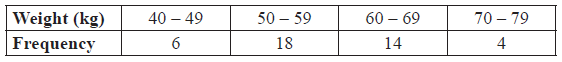
On the grid below draw a histogram to show the above weight distribution.
 [2]
[2]
Write down the mid-interval value for the \(40 – 49\) interval.[1]
Find an estimate of the mean weight of the members of the club.[2]
Write down an estimate of the standard deviation of their weights.[1]
Answer/Explanation
Markscheme
 (A1)(A1) (C2)
Notes: (A1) for all correct heights, (A1) for all correct end points (\(39.5\), \(49.5\) etc.).
Histogram must be drawn with a ruler (straight edge) and endpoints must be clear.
Award (A1) only if both correct histogram and correct frequency polygon drawn. [2 marks]
\(44.5\) (A1) (C1)
Note: If (b) is given as \(45\) then award
(b) \(45\) (A0)
(c) \(58.8{\text{ kg}}\) (M1)(A1)(ft) or (C2)(ft) if no working seen.
(d) \(8.44\) (C1)[1 mark]
Unit penalty (UP) applies in this question.
\({\text{Mean}} = \frac{{44.5 \times 6 + 54.5 \times 18 + \ldots }}{{42}}\) (M1)
Note: (M1) for a sum of frequencies multiplied by midpoint values divided by \(42\).
\( = 58.3{\text{ kg}}\) (A1)(ft) (C2)
Note: Award (A1)(A0)(AP) for \(58\).
Note: If (b) is given as \(45\) then award
(b) \(45\) (A0)
(c) \(58.8{\text{ kg}}\) (M1)(A1)(ft) or (C2)(ft) if no working seen.
(d) \(8.44\) (C1)[2 marks]
\({\text{Standard deviation}} = 8.44\) (A1) (C1)
Note: If (b) is given as \(45\) then award
(b) \(45\) (A0)
(c) \(58.8{\text{ kg}}\) (M1)(A1)(ft) or (C2)(ft) if no working seen.
(d) \(8.44\) (C1)[1 mark]
Question
Eight houses in a street are inhabited by different numbers of people, as shown in the table below.
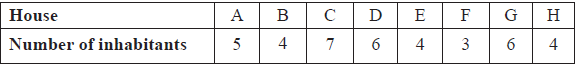
The following statements refer to the number of inhabitants per house. Write down true (T) or false (F) for each.
The mean is \(5\).[1]
The range is \(4\).[1]
The mode is \(6\).[1]
The standard deviation is \(1.4\) correct to \(2\) significant figures.[1]
Calculate the interquartile range for the number of inhabitants per house.[2]
Answer/Explanation
Markscheme
F (A1)[1 mark]
T (A1)[1 mark]
F (A1)[1 mark]
F (A1) (C4)[1 mark]
IQR = 6 − 4 (M1)
Note: Award (M1) for identifying correct quartiles.
IQR = 2 (A1)(ft) (C2)[2 marks]
Question
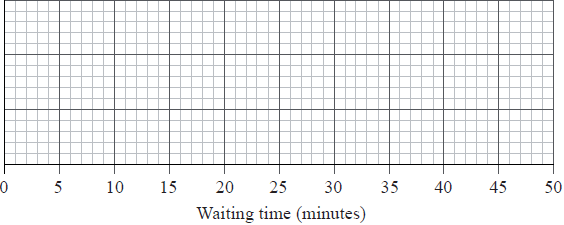
The cumulative frequency graph shows the amount of time in minutes, 200 students spend waiting for their train on a particular morning.
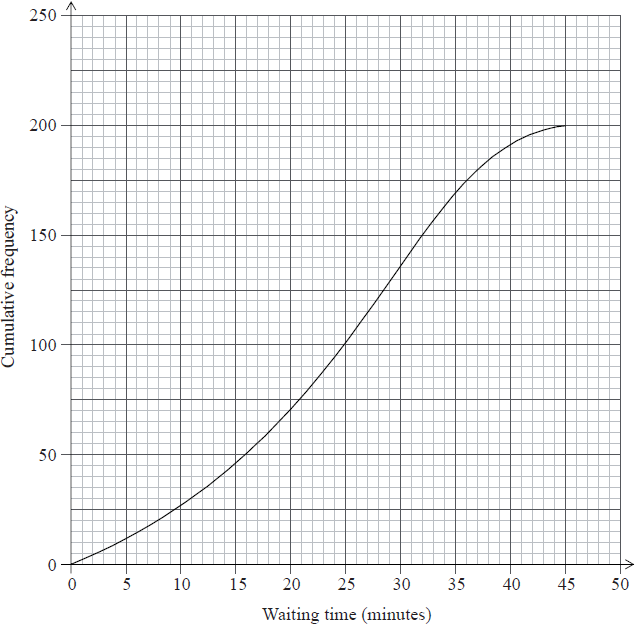
Write down the median waiting time.[1]
Find the interquartile range for the waiting time.[2]
Draw a box and whisker plot on the grid below to represent this information.
 [3]
[3]
Answer/Explanation
Markscheme
Median = 25 mins (A1) (C1)[1 mark]
32 – 16 (A1)
= 16 (A1)(ft) (C2)
Notes: Award (A1) for identifying correct quartiles, (A1)(ft) for correct answer to subtraction of their quartiles.[2 marks]
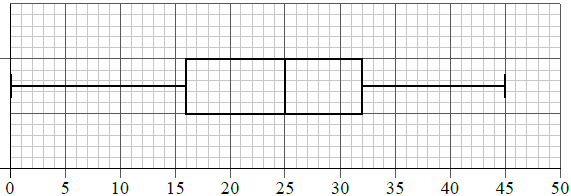
median shown (A1)(ft)
box with ends at their quartiles (A1)(ft)
end points at 0 and 45 joined to box with straight lines (A1) (C3)
Note: Award (A1)(ft)(A1)(ft)(A0) if lines go right through the box.[3 marks]
Question
56 students were given a test out of 40 marks. The teacher used the following box and whisker plot to represent the marks of the students.
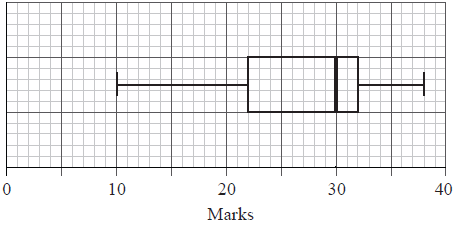
Write down the median mark.[1]
Write down the 75th percentile mark.[1]
Write down the range of marks.[2]
Estimate the number of students who achieved a mark greater than 32.[2]
Answer/Explanation
Markscheme
30 (A1) (C1)[1 mark]
32 (A1) (C1)[1 mark]
38 – 10 = 28 (A1)(A1) (C2)
Note: Award (A1) for 10 and 38 seen, (A1) for correct answer only.[2 marks]
0.25 × 56 = 14 (M1)(A1) (C2)
Note: Award (M1) for multiplying 0.25 by 56.[2 marks]
Question
The weights of 90 students in a school were recorded. The information is displayed in the following table.
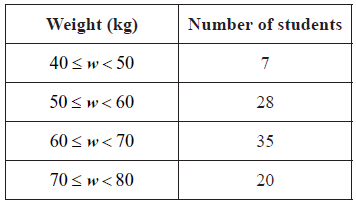
Write down the mid interval value for the interval \(50 \leqslant w \leqslant 60\).[1]
Use your graphic display calculator to find an estimate for the mean weight.[2]
Use your graphic display calculator to find an estimate for the standard deviation.[1]
Find the weight that is 3 standard deviations below the mean.[2]
Answer/Explanation
Markscheme
55 (A1) (C1)[1 mark]
\(62.\bar 5{\text{ }}\left( {62.6} \right)\) (A2)(ft) (C2)[2 marks]
8.86 (A1) (C1)
Note: Follow through from their answer to part (a).[1 mark]
62.6 – 3 × 8.86 = 36.0 (M1)(A1)(ft) (C2)
Note: Accept 36.
Follow through from their values in part (b) only if working is seen.[2 marks]
Question
The table below shows the frequency distribution of the number of dental fillings for a group of \(25\) children.
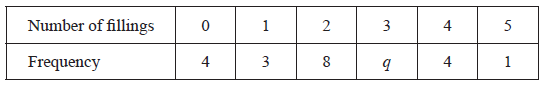
Find the value of \(q\) .[2]
Use your graphic display calculator to find
(i) the mean number of fillings;
(ii) the median number of fillings;
(iii) the standard deviation of the number of fillings.[4]
Answer/Explanation
Markscheme
\(q = 25 – (4 + 3 + 8 + 4 +1)\) (M1)
Note: Award (M1) for subtraction from \(25\) of all values from the table.
\( = 5\) (A1) (C2)[2 marks]
(i) \(2.2\) (A2)(ft) (C2)
Note: Award (M1) for use of mean formula with correct substitution. Follow through from part (a), irrespective of whether working is shown.
(ii) \(2\) (A1) (C1)
(iii) \(1.39\) (A1)(ft) (C1)
Note: Follow through from part (a), irrespective of whether working is shown. Award (A1) for \(1.38\).[4 marks]
Question
The weights in kg, of 80 adult males, were collected and are summarized in the box and whisker plot shown below.
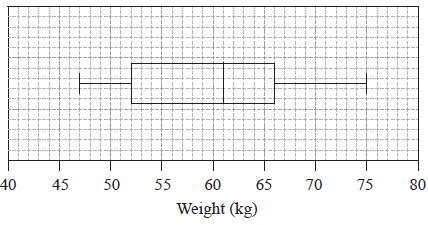
Write down the median weight of the males.[1]
Calculate the interquartile range.[2]
Estimate the number of males who weigh between \(61\) kg and \(66\) kg.[1]
Estimate the mean weight of the lightest \(40\) males.[2]
Answer/Explanation
Markscheme
\(61\) kg (A1) (C1)[1 mark]
\(66 – 52\) (A1)
\( = 14\) (A1)(ft) (C2)
Note: Award (A1) for identifying quartiles, (A1)(ft) for correct subtraction of their quartiles.[2 marks]
\(20\) (A1) (C1)[1 marks]
\(\frac{{49.5 \times 20 + 56.5 \times 20}}{{40}}\) (M1)
Note: Award (M1) for multiplication of midpoints by frequencies.
\(= 53\) kg (A1) (C2)[2 marks]
Question
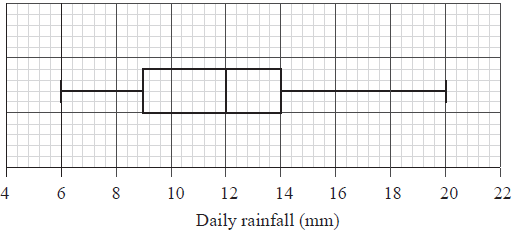
The daily rainfall for the town of St. Anna is collected over a 20-day period of time. The collected data are represented in the box and whisker plot below.
Write down
(i) the lowest daily rainfall;
(ii) the highest daily rainfall.[2]
State what the value of 12 mm represents on the given diagram.[1]
Find the interquartile range.[2]
Write down the percentage of the data which is less than the upper quartile.[1]
Answer/Explanation
Markscheme
(i) 6 (mm) (A1)
(ii) 20 (mm) (A1) (C2)[2 marks]
Median (A1) (C1)
Note: Award (A1) for Q2 or 50th percentile.[1 mark]
14 – 9 (A1)
Note: Award (A1) for 9 and 14 seen.
5 (mm) (A1) (C2)[2 marks]
75 (%) (A1) (C1)[1 mark]
Question
The cumulative frequency graph shows the heights, in cm, of 80 young trees.
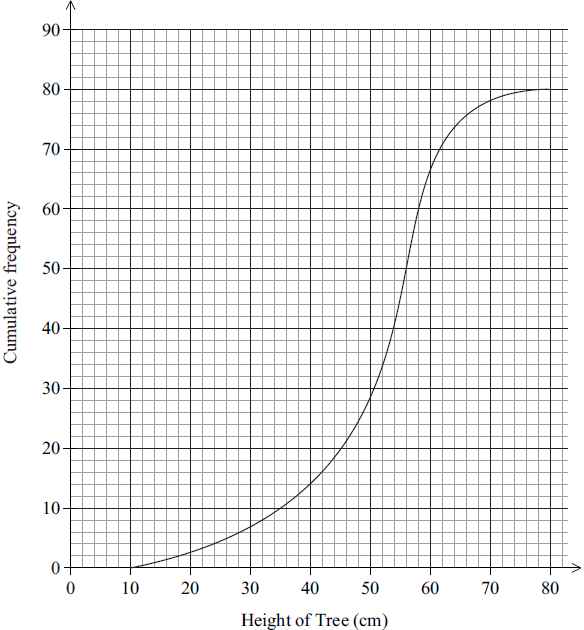
Write down the median height of the trees.[1]
Write down the 75th percentile.[1]
Find the interquartile range.[2]
Estimate the number of trees that are more than 40 cm in height.[2]
Answer/Explanation
Markscheme
54 (cm) (A1) (C1)
58 (A1) (C1)
58, 45 (A1)
Note: Award (A1) for 45 seen.
58 − 45
= 13 (A1)(ft) (C2)
Note: Follow through from part (b).
80 − 14 (M1)
Note: Award (M1) for 14 seen.
= 66 (A1) (C2)
Question
The weights, in kg, of 60 adolescent females were collected and are summarized in the box and whisker diagram shown below.
Write down the median weight of the females.[1]
Calculate the range.[2]
Estimate the probability that the weight of a randomly chosen female is more than 50 kg.[1]
Use the box and whisker diagram to determine if the mean weight of the females is less than the median weight. Give a reason for your answer.[2]
Answer/Explanation
Markscheme
42 kg (A1) (C1)
Note: The units are required.
58 − 33 (A1)
Note: Award (A1) for correct maximum and minimum seen.
= 25 (A1) (C2)
\(\frac{1}{4}(0.25,25\% )\) (A1) (C1)
Mean weight is more than the median weight. (A1)
The upper half of the distribution is wider (more dispersed) or data is positively (or right) skewed or equivalent reason. (R1)
OR
\(\left( {{\text{The mean is calculated }}\bar x = \frac{{35.5 \times 15 + 40 \times 15 + 54 \times 15}}{{60}}} \right)\)
\(\bar x = 43.875{\text{ }} (kg)\) (R1) (C2)
Note: Do not award (A1)(R0).
Question
A survey was carried out on a road to determine the number of passengers in each car (excluding the driver). The table shows the results of the survey.
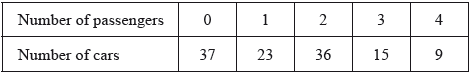
State whether the data is discrete or continuous.[1]
Write down the mode.[1]
Use your graphic display calculator to find
(i) the mean number of passengers per car;
(ii) the median number of passengers per car;
(iii) the standard deviation.[4]
Answer/Explanation
Markscheme
discrete (A1) (C1)[1 mark]
(i) \(1.47\) \((1.46666…)\) (A2)
Note: Award (M1) for \(\frac{{176}}{{120}}\) seen.
Accept \(1\) or \(2\) as a final answer if \(1.4666…\) or \(1.47\) seen.
(ii) \(1.5\) (A1)
(iii) \(1.25\) \((1.25122…)\) (A1) (C4)[4 marks]
Question
\(240\) cars were tested to see how far they travelled on \(10\) litres of fuel. The graph shows the cumulative frequency distribution of the results.
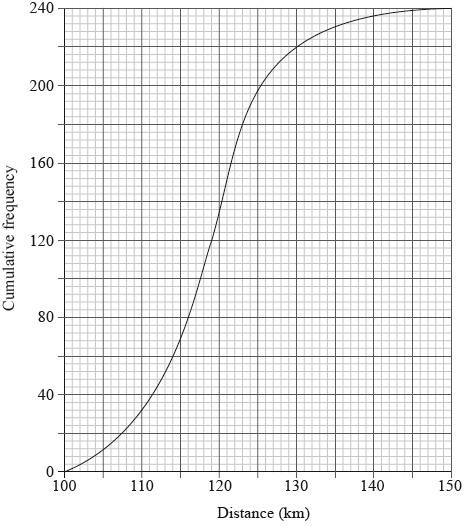
Find the median distance travelled by the cars.[2]
Calculate the interquartile range of the distance travelled by the cars.[2]
Find the number of cars that travelled more than \(130\) km.[2]
Answer/Explanation
Markscheme
\({{\text{Q}}_2} = 119{\text{ km}}\) (M1)(A1) (C2)
Note: Award (M1) for indication on graph of correct position of median.[2 marks]
\({{\text{Q}}_1} = 114{\text{ and }}{{\text{Q}}_3} = 123\) (A1)
Note: Award (A1) for correct quartiles seen.
\(9\) (A1) (C2)[2 marks]
\(240 – 220\) (M1)
Note: Award (M1) for \(220\) seen.
\( = 20\) (A1) (C2)[2 marks]
Question
The cumulative frequency graph represents the speed, s, in \({\text{km }}{{\text{h}}^{ – 1}}\), of 80 cars passing a speed camera.
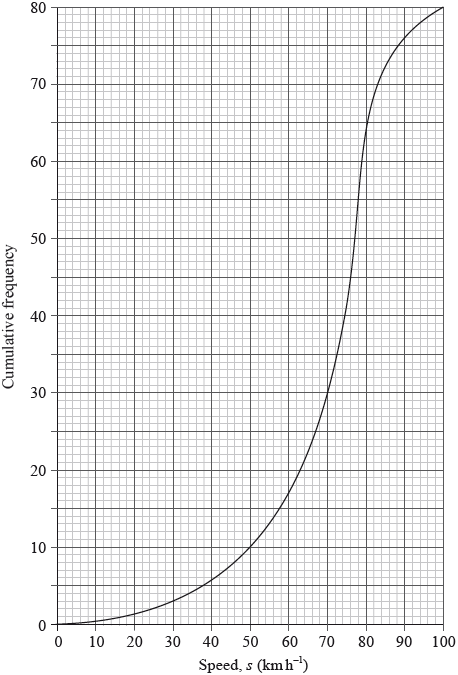
Write down the number of cars passing the camera with speed of less than or equal to 50 \({\text{km}}\,{{\text{h}}^{ – 1}}\).[1]
Complete the following grouped frequency table for \(s\), the speed of the cars passing the camera.
 [1]
[1]
Write down the mid-interval value of the \(50 < s \leqslant 70\) interval.[1]
Use your graphic display calculator to find an estimate of
(i) the mean speed of the cars passing the camera;
(ii) the standard deviation of the speed of the cars passing the camera.[3]
Answer/Explanation
Markscheme
10 (A1) (C1)[1 mark]
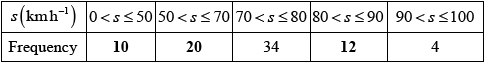 (A1)(ft) (C1)
Note: Follow through from their answer to part (a).[1 mark]
60 (A1) (C1)[1 mark]
(i) \(67.5 \left( {{\text{km}}\,{{\text{h}}^{ – 1}}} \right)\) (A2)(ft)
Notes: Award (M1) for an attempt to use the formula for the mean with at least two midpoint values consistent with their answer to part (c). Follow through from their table in part (b).
(ii) \(18.6 (18.6413…)\) (A1)(ft) (C3)
Note: Follow through from their table in part (b).[3 marks]
Question
The distribution of rainfall in a town over 80 days is displayed on the following box-and-whisker diagram.
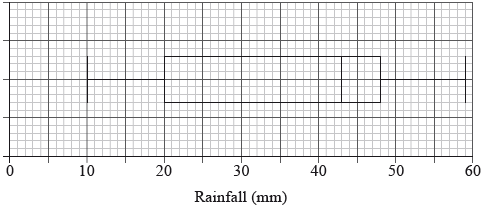
Write down the median rainfall.[1]
Write down the minimum rainfall.[1]
Find the interquartile range.[2]
Write down the number of days the rainfall will be
(i) between 43 mm and 48 mm;
(ii) between 20 mm and 59 mm.[2]
Answer/Explanation
Markscheme
\(43 {\text{ (mm)}}\) (A1) (C1)[1 mark]
\(10{\text{ (mm)}}\) (A1) (C1)[1 mark]
\(48 – 20\) (A1)
\( = 28\) (A1) (C2)
Note: Award (A1) for identifying correct quartiles, (A1) for correct subtraction of the quartiles.[2 marks]
(i) 20 (days) (A1)
(ii) 60 (days) (A1) (C2)[2 marks]
Question
The time, in minutes, that students in a school spend on their homework per day is presented in the following box-and-whisker diagram.
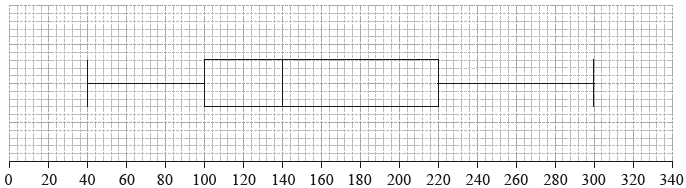
Time, in minutes, students spend on their homework per day
Find
(i) the longest amount of time spent on homework per day;
(ii) the interquartile range.[3]
State the statistical term corresponding to the value of 140 minutes.[1]
Find the percentage of students who spend
(i) between 100 and 140 minutes per day on their homework;
(ii) more than 100 minutes per day on their homework.[2]
Answer/Explanation
Markscheme
(i) 300 (minutes) OR 5 hours (A1)
Note: If answer given in hours, the unit must be seen.
(ii) 220 – 100 (M1)
Notes: Award (M1) for the two quartiles seen.
= 120 (minutes) OR 2 hours (A1) (C3)
Note: If answer given in hours, the unit must be seen.
median (time spent on homework per day) (A1) (C1)
Note: Do not accept middle or medium etc.
(i) 25 (A1)
(ii) 75 (A1) (C2)
Question
In a particular week, the number of eggs laid by each hen on a farm was counted. The results are summarized in the following table.
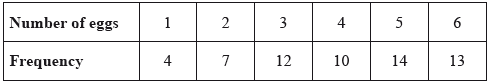
State whether these data are discrete or continuous.[1]
Write down
(i) the number of hens on the farm;
(ii) the modal number of eggs laid.[2]
Calculate
(i) the mean number of eggs laid;
(ii) the standard deviation.[3]
Answer/Explanation
Markscheme
discrete (A1) (C1)
(i) 60 (A1)
(ii) 5 (A1) (C2)
(i) \(\frac{{1 \times 4 + 2 \times 7 + 3 \times 12 \ldots }}{{60}}\) (M1)
Notes: Award (M1) for an attempt to substitute into the “mean of a set of data” formula, with at least three correct terms in the numerator.
Denominator must be 60.
Follow through from part (b)(i), only if work is seen.
\( = 4.03{\text{ }}(4.03333 \ldots )\) (A1)
Notes: Award at most (M1)(A0) for an answer of 4 but only if working seen.
(ii) \(1.54{\text{ }}(1.53803 \ldots )\) (A1) (C3)
Question
In a school 160 students sat a mathematics examination. Their scores, given as marks out of 90, are summarized on the cumulative frequency diagram.
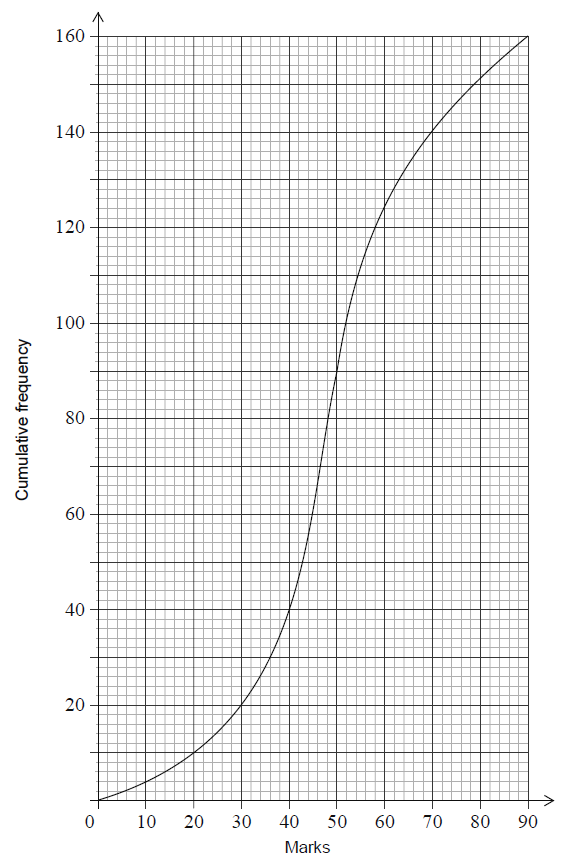
Write down the median score.[1]
The lower quartile of these scores is 40.
Find the interquartile range.[2]
The lowest score was 6 marks and the highest score was 90 marks.
Draw a box-and-whisker diagram on the grid below to represent the students’ examination scores.
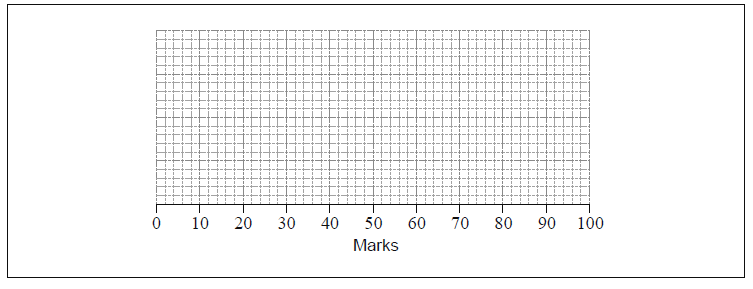 [3]
[3]
Answer/Explanation
Markscheme
48 (A1) (C1)
\(58 – 40\) (M1)
Note: Award (M1) for 58 and 40 seen.
\( = 18\) (A1) (C2)
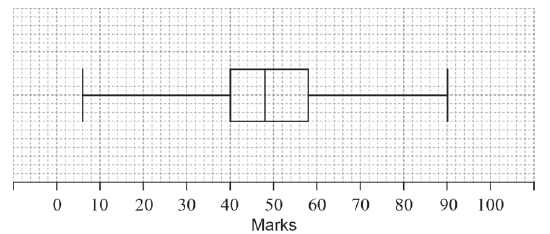
(A1)(A1)(ft)(A1)(ft) (C3)
Note: Award (A1) for the correct maximum and minimum, (A1)(ft) for their correct median and (A1)(ft) for 40 and their upper quartile.
Follow through from parts (a) and (b).
Award a maximum of (A1)(A1)(ft)(A0) if the horizontal line goes through the box or if a ruler has clearly not been used.
Question
A sample of 120 oranges was tested for Vitamin C content. The cumulative frequency curve below represents the Vitamin C content, in milligrams, of these oranges.
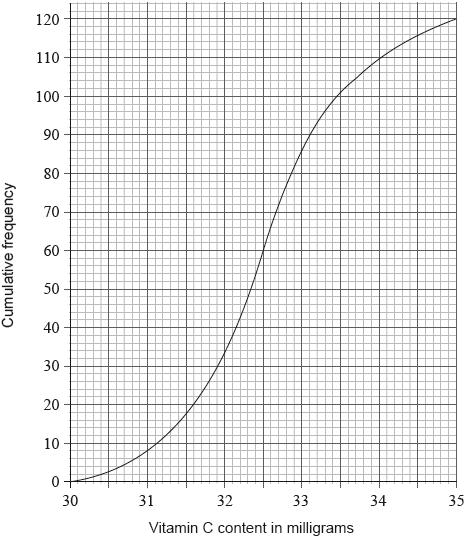
The minimum level of Vitamin C content of an orange in the sample was 30.1 milligrams. The maximum level of Vitamin C content of an orange in the sample was 35.0 milligrams.
Giving your answer to one decimal place, write down the value of
(i) the median level of Vitamin C content of the oranges in the sample;
(ii) the lower quartile;
(iii) the upper quartile.[3]
Draw a box-and-whisker diagram on the grid below to represent the Vitamin C content, in milligrams, for this sample.
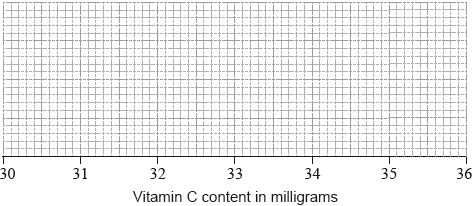 [3]
[3]
Answer/Explanation
Markscheme
(i) 32.5 (A1)
(ii) 31.9 (A1)
(iii) 33.1 (A1) (C3)
Note: Answers must be given correct to 1 decimal place.[3 marks]
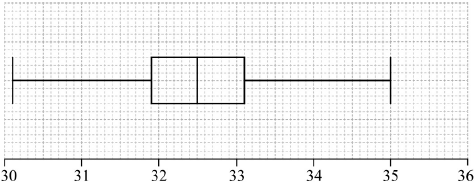
Note: Award (A1)(ft) for correct median, (A1)(ft) for correct quartiles and box, (A1) for correct end points of whiskers and straight whiskers.
Award at most (A1)(A1)(A0) if a horizontal line goes right through the box or if the whiskers are not well aligned with the midpoint of the box.
Follow through from part (a).[3 marks]
Question
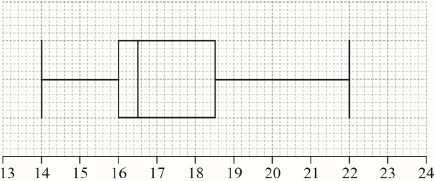
A group of 20 students travelled to a gymnastics tournament together. Their ages, in years, are given in the following table.
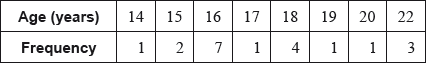
The lower quartile of the ages is 16 and the upper quartile is 18.5.
For the students in this group find the mean age;[2]
For the students in this group write down the median age.[1]
Draw a box-and-whisker diagram, for these students’ ages, on the following grid.
 [3]
[3]
Answer/Explanation
Markscheme
\(\frac{{14 + 2 \times 15 + 7 \times 16 + 17 + 4 \times 18 + 19 + 20 + 3 \times 22}}{{20}}\) (M1)
Note: Award (M1) for correct substitutions into mean formula.
\(( = ){\text{ }}17.5\) (A1) (C2)[2 marks]
16.5 (A1) (C1)[1 mark]
 (A1)(A1)(A1)(ft) (C3)
Note: Award (A1) for correct endpoints, (A1) for correct quartiles, (A1)(ft) for their median. Follow through from part (a)(ii), but only if median is between 16 and 18.5. If a horizontal line goes through the box, award at most (A1)(A1)(A0). Award at most (A0)(A1)(A1) if a ruler has not been used.[3 marks]