Question
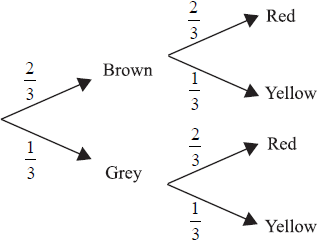
Neil has three dogs. Two are brown and one is grey. When he feeds the dogs, Neil uses three bowls and gives them out randomly. There are two red bowls and one yellow bowl. This information is shown on the tree diagram below.
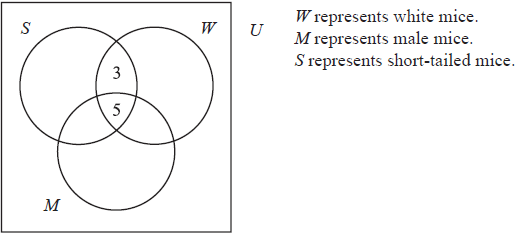
There are 49 mice in a pet shop.
30 mice are white.
27 mice are male.
18 mice have short tails.
8 mice are white and have short tails.
11 mice are male and have short tails.
7 mice are male but neither white nor short-tailed.
5 mice have all three characteristics and
2 have none.
Copy the diagram below to your examination script.
One of the dogs is chosen at random.
(i) Find P (the dog is grey and has the yellow bowl).
(ii) Find P (the dog does not get the yellow bowl).[3]
Neil often takes the dogs to the park after they have eaten. He has noticed that the grey dog plays with a stick for a quarter of the time and both brown dogs play with sticks for half of the time. This information is shown on the tree diagram below.
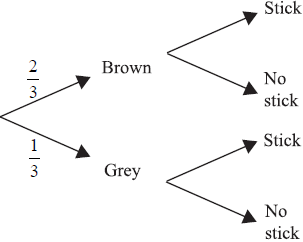
(i) Copy the tree diagram and add the four missing probability values on the branches that refer to playing with a stick.
During a trip to the park, one of the dogs is chosen at random.
(ii) Find P (the dog is grey or is playing with a stick, but not both).
(iii) Find P (the dog is grey given that the dog is playing with a stick).
(iv) Find P (the dog is grey and was fed from the yellow bowl and is not playing with a stick).[9]
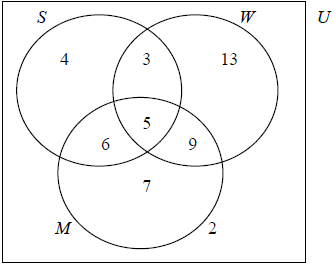
Complete the diagram, using the information given in the question.[4]
Find (i) \(n(M \cap W)\)
(ii) \(n(M′ \cup S)\)[3]
Two mice are chosen without replacement.
Find P (both mice are short-tailed).[2]
Answer/Explanation
Markscheme
(i) P (a dog is grey and has the yellow bowl)
\( = \frac{1}{3} \times \frac{1}{3} = \frac{1}{9}( = 0.111)\) (M1)(A1)(G2)
The (M1) is for multiplying two values along any branch of the tree.(ii) P (dog does not get yellow bowl) \( = \frac{2}{3}\) ( = 0.667 (3sf) or 0.6) (A1)[3 marks]
(i) The tree diagram should show the values \(\frac{1}{2},\frac{1}{2}\) for the brown branch and \(\frac{1}{4},\frac{3}{4}\) in the correct positions for the grey branch. (A1)(A1)(ft)
Follow through if the branches are interchanged.
(ii) P (the dog is grey or is playing with a stick, but not both)
\( = \frac{1}{3} \times \frac{3}{4} + \frac{2}{3} \times \frac{1}{2}\) (M1)
\( = \frac{7}{{12}}\) ( = 0.583) (A1)(ft)(G1)
The (M1) is for showing two correct products (whether added or not). Follow through from b(i). Award (M1) for \( \frac{1}{3} + \frac{1}{4}\) (must be a sum).
(iii) P (dog is grey given that it is playing with stick)
\(\frac{{P(G \cap S)}}{{P(S)}} = \frac{{\frac{1}{3} \times \frac{1}{4}}}{{\left( {\frac{2}{3} \times \frac{1}{2}} \right) + \left( {\frac{1}{3} \times \frac{1}{4}} \right)}}\) or \(\frac{1}{{12}}/\frac{5}{{12}}\) (M1)(A1)(ft)
(M1) for substituted conditional probability formula, (A1) for correct substitutions.
\( = \frac{1}{5}\) ( = 0.2) (A1)(ft)(G2)
(iv) P (grey and fed from yellow bowl and not playing with stick) \( = \frac{1}{3} \times \frac{1}{3} \times \frac{3}{4} = \frac{1}{{12}}\) ( = \(\frac{3}{{36}}\) = 0.0833 3sf). (M1)(A1)(ft)(G1)
(M1) is for product of 3 reasonable probability values.[9 marks]
 (A1)(A1)(A1)(ft)(A1)(ft)
Award (A1) for 2 (must be in a box), (A1) for 7, (A1)(ft) for 6 and 4, (A1)(ft) for 9 and 13. Observe the assignment of (ft) marks strictly here. Example A common error is likely to be 11 instead of 6 (A0). In this case follow through to 4 and 18 (A1)(ft) for the final pair. Here the 4 follows from the total of 27 for n(M).[4 marks]
(i) \(n(M \cap W) = 14\) (A1)(ft)
(ii) \(n(M’ \cup S) = 22 + 11\) OR \(15 + 18\) (A1)(ft)
= 33 (A1)(ft)
Award (A2) if answer 33 is seen. Award (A1) for any of 22, 11, 15 or 18 seen but 33 absent.[3 marks]
P (both mice short-tailed) \( = \frac{{18}}{{49}} \times \frac{{17}}{{48}} = \frac{{306}}{{352}}\) (= 0.130). (M1)(A1)(ft)(G1)
(Allow alternatives such as 153/1176 or 51/392.) Award (M1) for any of \(\frac{{18}}{{49}}\) and \(\frac{{17}}{{48}}\) or \(\frac{{18}}{{49}} \times \frac{{17}}{{49}}\) or \(\frac{{18}}{{49}} + \frac{{17}}{{48}}\) seen.[2 marks]
Question
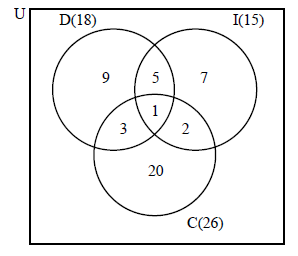
A group of 50 students completed a questionnaire for a Mathematical Studies project. The following data was collected.
\(18\) students own a digital camera (D)
\(15\) students own an iPod (I)
\(26\) students own a cell phone (C)
\(1\) student owns all three items
\(5\) students own a digital camera and an iPod but not a cell phone
\(2\) students own a cell phone and an iPod but not a digital camera
\(3\) students own a cell phone and a digital camera but not an iPod
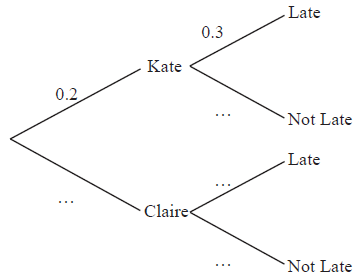
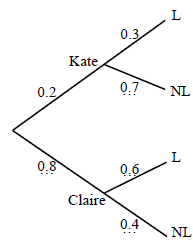
Claire and Kate both wish to go to the cinema but one of them has to stay at home to baby-sit.
The probability that Kate goes to the cinema is \(0.2\). If Kate does not go Claire goes.
If Kate goes to the cinema the probability that she is late home is \(0.3\).
If Claire goes to the cinema the probability that she is late home is \(0.6\).
Represent this information on a Venn diagram.[4]
Calculate the number of students who own none of the items mentioned above.[2]
If a student is chosen at random, write down the probability that the student owns a digital camera only.[1]
If two students are chosen at random, calculate the probability that they both own a cell phone only.[3]
If a student owns an iPod, write down the probability that the student also owns a digital camera.[2]
Copy and complete the probability tree diagram below.
 [3]
[3]
Calculate the probability that
(i) Kate goes to the cinema and is not late;
(ii) the person who goes to the cinema arrives home late.[5]
Answer/Explanation
Markscheme
 (A1)(A1)(A1)(A1)(ft)
Note: (A1) for rectangle with 3 intersecting circles, (A1) for \(1\), (A1) for \(5\), \(3\), \(2\), (A1)(ft) for \(9\), \(7\), \(20\) if subtraction is carried out, or \(18\), \(15\), \(26\) seen by the letters D, I and C.[4 marks]
\(50 – 47\) (M1)
Note: (M1) for subtracting their value from \(50\).
\( = 3\) (A1)(ft)(G2)[2 marks]
\(\frac{9}{{50}}\) (A1)(ft)[1 mark]
\(\frac{{20}}{{50}} \times \frac{{19}}{{49}}\) (A1)(ft)(M1)
\( = \frac{{38}}{{245}}{\text{ }}\left( {\frac{{380}}{{2450}}{\text{, }}0.155{\text{, }}15.5\% } \right)\) (A1)(ft)(G2)
Notes: (A1)(ft) for correct fractions from their Venn diagram
(M1) for multiplying their fractions
(A1)(ft) for correct answer.[3 marks]
\(\frac{6}{{15}}{\text{ }}\left( {\frac{2}{5}{\text{, }}0.4{\text{, }}40\% } \right)\) (A1)(ft)(A1)(ft)
Note: (A1)(ft) for numerator, (A1)(ft) denominator.[2 marks]
 (A1)(A1)(A1)
Note: (A1) for \(0.8\), (A1) for \(0.7\), (A1) for \(0.6\) and \(0.4\).[3 marks]
(i) \(0.2 \times 0.7 = 0.14\) (M1)(A1)(ft)(G2)
Note: (M1) for multiplying correct numbers.[2 marks]
(ii) \(0.2 \times 0.3 + 0.8 \times 0.6\) (M1)(M1)
\( = 0.54\) (A1)(ft)(G3)
Note: (M1) for each correct product (use candidate’s tree), (A1)(ft) for answer.[3 marks]
Question
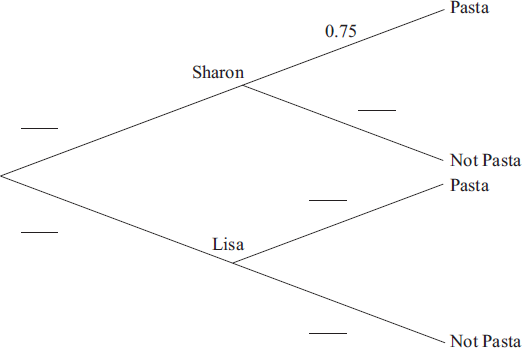
Sharon and Lisa share a flat. Sharon cooks dinner three nights out of ten. If Sharon does not cook dinner, then Lisa does. If Sharon cooks dinner the probability that they have pasta is 0.75. If Lisa cooks dinner the probability that they have pasta is 0.12.
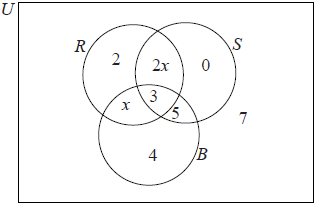
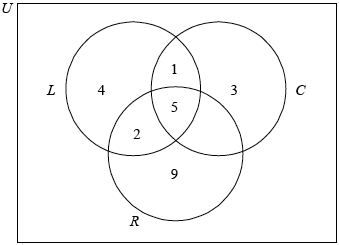
A survey was carried out in a year 12 class. The pupils were asked which pop groups they like out of the Rockers (R), the Salseros (S), and the Bluers (B). The results are shown in the following diagram.
Copy and complete the tree diagram to represent this information.
 [3]
[3]
Find the probability that Lisa cooks dinner and they do not have pasta.[2]
Find the probability that they do not have pasta.[3]
Given that they do not have pasta, find the probability that Lisa cooked dinner.[3]
Write down \(n(R \cap S \cap B)\).[1]
Find \(n(R’)\).[2]
Describe which groups the pupils in the set \(S \cap B\) like.[2]
Use set notation to describe the group of pupils who like the Rockers and the Bluers but do not like the Salseros.[2]
There are 33 pupils in the class.
Find x.[2]
There are 33 pupils in the class.
Find the number of pupils who like the Rockers.[1]
Answer/Explanation
Markscheme
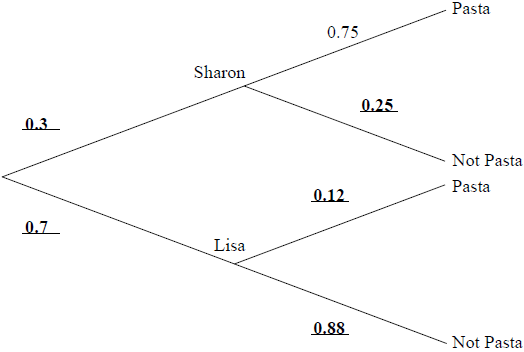
Note: Award (A1) for each correct pair. (A3) [3 marks]
\(0.7 \times 0.88 = 0.616{\text{ }}\left( {\frac{{77}}{{125}},{\text{ }}61.6{\text{ }}\% } \right)\) (M1)(A1)(ft)(G2)
Note: Award (M1) for multiplying the correct probabilities.[2 marks]
\(0.3 \times 0.25 + 0.7 \times 0.88\) (M1)(M1)
Notes: Award (M1) for a relevant two-factor product, could be \(S \times NP\) OR \(L \times NP\).
Award (M1) for summing 2 two-factor products.
\({\text{P}} = 0.691{\text{ }}\left( {\frac{{691}}{{1000}},{\text{ }}69.1{\text{ }}\% } \right)\) (A1)(ft)(G2)
Notes: (ft) from their answer to (b).[3 marks]
\(\frac{{0.616}}{{0.691}}\) (M1)(A1)
Note: Award (M1) for substituted conditional probability formula, (A1) for correct substitution.
\({\text{P}} = 0.891{\text{ }}\left( {\frac{{616}}{{691}},{\text{ }}89.1{\text{ }}\% } \right)\) (A1)(ft)(G2)[3 marks]
3 (A1)[1 mark]
For 5, 4, 7 (0) seen with no extra values (A1)
16 (A1)(G2)[2 marks]
They like (both) the Salseros (S) and they like the Bluers (B) (A1)(A1)
Note: Award (A1) for “and”, (A1) for the correct groups.[2 marks]
\(R \cap B \cap S’\) (A1)(A1)
Note: Award (A1) for \(R \cap B\), (A1) for \( \cap S’\)[2 marks]
\(21+ 3x = 33\) (M1)
\(x = 4\) (A1)(G2)[2 marks]
17 (A1)(ft)[1 mark]
Question
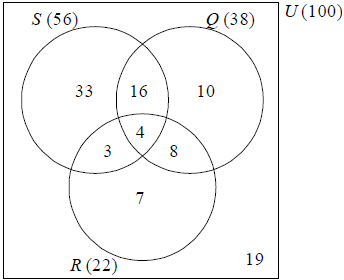
A survey of 100 families was carried out, asking about the pets they own. The results are given below.
56 owned dogs (S)
38 owned cats (Q)
22 owned birds (R)
16 owned dogs and cats, but not birds
8 owned birds and cats, but not dogs
3 owned dogs and birds, but not cats
4 owned all three types of pets
Draw a Venn diagram to represent this information.[5]
Find the number of families who own no pets.[2]
Find the percentage of families that own exactly one pet.[3]
A family is chosen at random. Find the probability that they own a cat, given that they own a bird.[2]
Answer/Explanation
Markscheme
 (A1)(A1)(A1)(A1)(A1)
Note: Award (A1) for rectangle (U not required), (A1) for 3 intersecting circles, (A1) for 4 in central intersection, (A1) for 16, 3, 8 and (A1) for 33, 10, 7 (ft) if subtraction is carried out, or for S(56), Q(38) and R(22) seen by the circles.[5 marks]
100 − 81 (M1)
19 (A1)(ft)(G2)
Note: Award (M1) for subtracting their total from 100.[2 marks]
\(33 +10 + 7\) (M1)
Note: Award (M1) for adding their values from (a).
\(\left( {\frac{{50}}{{100}}} \right) \times 100{\text{ }}\% \) (A1)(ft)
50 % (50) (A1)(ft)(G3)[3 marks]
P (own a cat given they own a bird) \( = \frac{{12}}{{22}}\left( {0.545,\frac{6}{{11}}} \right)\) (A1)(ft)(A1)(ft)
Note: Award (A1)(ft) for the numerator, (A1)(ft) for the denominator.[2 marks]
Question
Part A
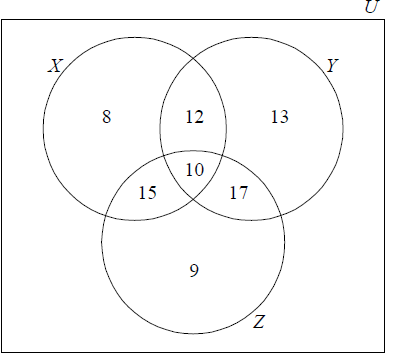
100 students are asked what they had for breakfast on a particular morning. There were three choices: cereal (X) , bread (Y) and fruit (Z). It is found that
10 students had all three
17 students had bread and fruit only
15 students had cereal and fruit only
12 students had cereal and bread only
13 students had only bread
8 students had only cereal
9 students had only fruit
Part B
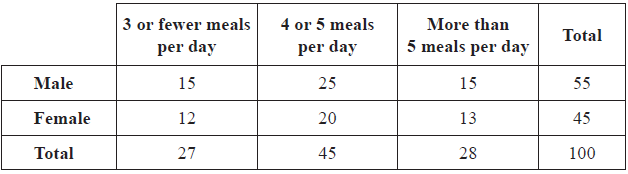
The same 100 students are also asked how many meals on average they have per day. The data collected is organized in the following table.
A \({\chi ^2}\) test is carried out at the 5 % level of significance.
Represent this information on a Venn diagram.[4]
Find the number of students who had none of the three choices for breakfast.[2]
Write down the percentage of students who had fruit for breakfast.[2]
Describe in words what the students in the set \(X \cap Y’\) had for breakfast.[2]
Find the probability that a student had at least two of the three choices for breakfast.[2]
Two students are chosen at random. Find the probability that both students had all three choices for breakfast.[3]
Write down the null hypothesis, H0, for this test.[1]
Write down the number of degrees of freedom for this test.[1]
Write down the critical value for this test.[1]
Show that the expected number of females that have more than 5 meals per day is 13, correct to the nearest integer.[2]
Use your graphic display calculator to find the \(\chi _{calc}^2\) for this data.[2]
Decide whether H0 must be accepted. Justify your answer.[2]
Answer/Explanation
Markscheme
(A1) for rectangle and three intersecting circles
(A1) for 10, (A1) for 8, 13 and 9, (A1) for 12, 15 and 17 (A4)[4 marks]
100 – (9 +12 +13 +15 +10 +17 + 8) =16 (M1)(A1)(ft)(G2)
Note: Follow through from their diagram.[2 marks]
\(\frac{{51}}{{100}}(0.51)\) (A1)(ft)
= 51% (A1)(ft)(G2)
Note: Follow through from their diagram.[2 marks]
Note: The following statements are correct. Please note that the connectives are important. It is not the same (had cereal) and (not bread) and (had cereal) or (not bread). The parentheses are not needed but are there to facilitate the understanding of the propositions.
(had cereal) and (did not have bread)
(had cereal only) or (had cereal and fruit only)
(had either cereal or (fruit and cereal)) and (did not have bread) (A1)(A1)
Notes: If the statements are correct but the connectives are wrong then award at most (A1)(A0). For the statement (had only cereal) and (cereal and fruit) award (A1)(A0). For the statement had cereal and fruit award (A0)(A0).[2 marks]
\(\frac{{54}}{{100}}(0.54,{\text{ 54 % }})\) (A1)(ft)(A1)(ft)(G2)
Note: Award (A1)(ft) for numerator, follow through from their diagram, (A1)(ft) for denominator. Follow through from total or denominator used in part (c).[2 marks]
\(\frac{{10}}{{100}} \times \frac{9}{{99}} = \frac{1}{{110}}(0.00909,{\text{ 0}}{\text{.909 % }})\) (A1)(ft)(M1)(A1)(ft)(G2)
Notes: Award (A1)(ft) for their correct fractions, (M1) for multiplying two fractions, (A1)(ft) for their correct answer. Answer 0.009 with no working receives no marks. Follow through from denominator in parts (c) and (e) and from their diagram.[3 marks]
H0 : The (average) number of meals per day a student has and gender are independent (A1)
Note: For “independent” accept “not associated” but do not accept “not related” or “not correlated”.[1 mark]
2 (A1)[1 mark]
5.99 (accept 5.991) (A1)(ft)
Note: Follow through from their part (b).[1 mark]
\(\frac{{28 \times 45}}{{100}} = 12.6 = 13\) or \(\frac{{28}}{{100}} \times \frac{{25}}{{100}} \times 100 = 12.6 = 13\) (M1)(A1)(AG)
Notes: Award (M1) for correct formula and (A1) for correct substitution. Unrounded answer must be seen for the (A1) to be awarded.[2 marks]
0.0321 (G2)
Note: For 0.032 award (G1)(G1)(AP). For 0.03 with no working award (G0).[2 marks]
0.0321 < 5.99 or 0.984 > 0.05 (R1)
accept H0 (A1)(ft)
Note: If reason is incorrect both marks are lost, do not award (R0)(A1).[2 marks]
Question
One day the numbers of customers at three cafés, “Alan’s Diner” ( \(A\) ), “Sarah’s Snackbar” ( \(S\) ) and “Pete’s Eats” ( \(P\) ), were recorded and are given below.
17 were customers of Pete’s Eats only
27 were customers of Sarah’s Snackbar only
15 were customers of Alan’s Diner only
10 were customers of Pete’s Eats and Sarah’s Snackbar but not Alan’s Diner
8 were customers of Pete’s Eats and Alan’s Diner but not Sarah’s Snackbar
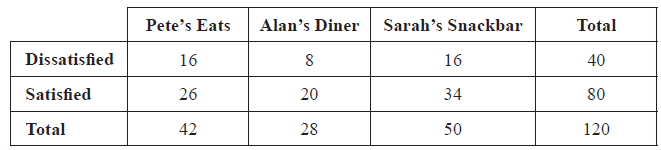
Some of the customers in each café were given survey forms to complete to find out if they were satisfied with the standard of service they received.
Draw a Venn Diagram, using sets labelled \(A\) , \(S\) and \(P\) , that shows this information.[3]
There were 48 customers of Pete’s Eats that day. Calculate the number of people who were customers of all three cafés.[2]
There were 50 customers of Sarah’s Snackbar that day. Calculate the total number of people who were customers of Alan’s Diner.[3]
Write down the number of customers of Alan’s Diner that were also customers of Pete’s Eats.[1]
Find \(n[(S \cup P) \cap A’]\).[2]
One of the survey forms was chosen at random, find the probability that the form showed “Dissatisfied”;[2]
One of the survey forms was chosen at random, find the probability that the form showed “Satisfied” and was completed at Sarah’s Snackbar;[2]
One of the survey forms was chosen at random, find the probability that the form showed “Dissatisfied”, given that it was completed at Alan’s Diner.[2]
A \({\chi ^2}\) test at the \(5\% \) significance level was carried out to determine whether there was any difference in the level of customer satisfaction in each of the cafés.
Write down the null hypothesis, \({{\text{H}}_0}\) , for the \({\chi ^2}\) test.[1]
A \({\chi ^2}\) test at the \(5\% \) significance level was carried out to determine whether there was any difference in the level of customer satisfaction in each of the cafés.
Write down the number of degrees of freedom for the test.[1]
A \({\chi ^2}\) test at the \(5\% \) significance level was carried out to determine whether there was any difference in the level of customer satisfaction in each of the cafés.
Using your graphic display calculator, find \({\chi ^2}_{calc}\) .[2]
A \({\chi ^2}\) test at the \(5\% \) significance level was carried out to determine whether there was any difference in the level of customer satisfaction in each of the cafés.
State, giving a reason, the conclusion to the test.[2]
Answer/Explanation
Markscheme
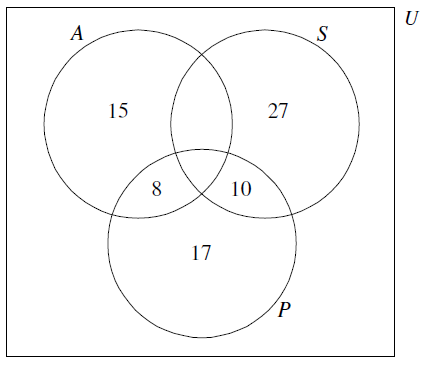
(A1) for rectangle and three labelled intersecting circles
(A1) for \(15\), \(27\) and \(17\)
(A1) for \(10\) and \(8\) (A3)[3 marks]
\(48 – (8 +10 +17)\) or equivalent (M1)
\( = 13\) (A1)(ft)(G2)[2 marks]
\(50 – (27 +10 +13)\) (M1)
Note: Award (M1) for working seen.
\( = 0\) (A1)
number of elements in A \(= 36\) (A1)(ft)(G3)
Note: Follow through from (b).[3 marks]
\(21\) (A1)(ft)
Note: Follow through from (b) even if no working seen.[1 mark]
\(54\) (M1)(A1)(ft)(G2)
Note: Award (M1) for \(17\), \(10\), \(27\) seen. Follow through from (a).[2 marks]
\(\frac{{40}}{{120}}{\text{ }}\left( {\frac{1}{3}{\text{, }}0.333{\text{, }}33.3\% } \right)\) (A1)(A1)(G2)
Note: Award (A1) for numerator, (A1) for denominator.[2 marks]
\(\frac{{34}}{{120}}{\text{ }}\left( {\frac{{17}}{{60}}{\text{, }}0.283{\text{, }}28.3\% } \right)\) (A1)(A1)(G2)
Note: Award (A1) for numerator, (A1) for denominator.[2 marks]
\(\frac{8}{{28}}{\text{ }}\left( {\frac{2}{7}{\text{, }}0.286{\text{, }}28.6\% } \right)\) (A1)(A1)(G2)
Note: Award (A1) for numerator, (A1) for denominator.[2 marks]
customer satisfaction is independent of café (A1)
Note: Accept “customer satisfaction is not associated with the café”.[1 mark]
\(2\) (A1)[1 mark]
\(0.754\) (G2)
Note: Award (G1)(G1)(AP) for \(0.75\) or for correct answer incorrectly rounded to 3 s.f. or more, (G0) for \(0.7\).[2 marks]
since \({\chi ^2}_{calc} < {\chi ^2}_{crit}5.991 accept (or Do not reject) H0 (R1)(A1)(ft)
Note: Follow through from their value in (e).
OR
Accept (or Do not reject) H0 as \(p\)-value \((0.686) > 0.05\) (R1)(A1)(ft)
Notes: Do not award (A1)(R0). Award the (R1) for comparison of appropriate values.[2 marks]
Question
Beartown has three local newspapers: The Art Journal, The Beartown News, and The Currier.
A survey shows that
32 % of the town’s population read The Art Journal,
46 % read The Beartown News,
54 % read The Currier,
3 % read The Art Journal and The Beartown News only,
8 % read The Art Journal and The Currier only,
12 % read The Beartown News and The Currier only, and
5 % of the population reads all three newspapers.
Draw a Venn diagram to represent this information. Label A the set that represents The Art Journal readers, B the set that represents The Beartown News readers, and C the set that represents The Currier readers.[4]
Find the percentage of the population that does not read any of the three newspapers.[2]
Find the percentage of the population that reads exactly one newspaper.[2]
Find the percentage of the population that reads The Art Journal or The Beartown News but not The Currier.[2]
A local radio station states that 83 % of the population reads either The Beartown News or The Currier.
Use your Venn diagram to decide whether the statement is true. Justify your answer.[2]
The population of Beartown is 120 000. The local radio station claimed that 34 000 of the town’s citizens read at least two of the local newspapers.
Find the percentage error in this claim.[4]
Answer/Explanation
Markscheme
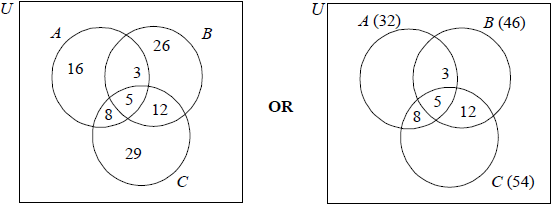
(A1) for three circles and a rectangle (U need not be seen)
(A1) for 5
(A1) for 3, 8 and 12
(A1) for 16, 26 and 29 OR 32, 46, 54 placed outside the circles. (A4)
Note: Accept answers given as decimals or fractions.[4 marks]
100 – (16 + 26 + 29) – (8 + 5 + 3 + 12) (M1)
100 – 71 – 28
Note: Award (M1) for correct expression. Accept equivalent expressions, for example 100 – 71 – 28 or 100 – (71 + 28).
= 1 (A1)(ft)(G2)
Note: Follow through from their Venn diagram but only if working is seen.[2 marks]
16 + 26 + 29 (M1)
Note: Award (M1) for 16, 26, 29 seen.
= 71 (A1)(ft)(G2)
Note: Follow through from their Venn diagram but only if working is seen.[2 marks]
16 + 3 + 26 (M1)
Note: Award (M1) for their 16, 3, 26 seen.
= 45 (A1)(ft)(G2)
Note: Follow through from their Venn diagram but only if working is seen.[2 marks]
True (A1)(ft)
100 – (1 –16) = 83 (R1)(ft)
OR
46 + 54 – 17 = 83 (R1)(ft)
Note: Do not award (A1)(R0). Follow through from their Venn diagram.[2 marks]
28% of 120000 (M1)
= 33600 (A1)
\({\text{% error}} = \frac{{(34000 – 33600)}}{{33600}} \times 100\) (M1)
Note: Award (M1) for 28 seen (may be implied by 33600 seen), award (M1) for correct substitution of their 33600 in the percentage error formula. If an error is made in calculating 33600 award a maximum of (M1)(A0)(M1)(A0), the final accuracy mark is lost.
OR
\(\frac{{34000}}{{120000}} \times 100\) (M1)
= 28.3(28.3333…) (A1)
\({\text{% error}} = \frac{{(28.3333… – 28)}}{{28}} \times 100\) (M1)
= 1.19% (1.19047…) (A1)(ft)(G3)
Note: % sign not required. Accept 1.07 (1.0714…) with use of 28.3. 1.18 with use of 28.33 and 1.19 with use of 28.333. Award (G3) for 1.07, 1.18 or 1.19 seen without working.[4 marks]
Question
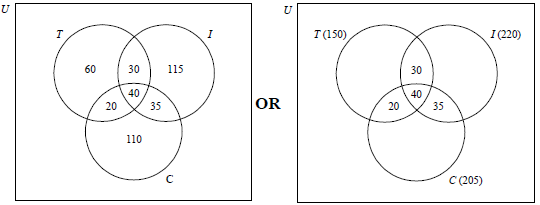
In a college 450 students were surveyed with the following results
150 have a television
205 have a computer
220 have an iPhone
75 have an iPhone and a computer
60 have a television and a computer
70 have a television and an iPhone
40 have all three.
Draw a Venn diagram to show this information. Use T to represent the set of students who have a television, C the set of students who have a computer and I the set of students who have an iPhone.[4]
Write down the number of students that
(i) have a computer only;
(ii) have an iPhone and a computer but no television.[2]
Write down \(n[T \cap (C \cup I)’]\).[1]
Calculate the number of students who have none of the three.[2]
Two students are chosen at random from the 450 students. Calculate the probability that
(i) neither student has an iPhone;
(ii) only one of the students has an iPhone.[6]
The students are asked to collect money for charity. In the first month, the students collect x dollars and the students collect y dollars in each subsequent month. In the first 6 months, they collect 7650 dollars. This can be represented by the equation x + 5y = 7650.
In the first 10 months they collect 13 050 dollars.
(i) Write down a second equation in x and y to represent this information.
(ii) Write down the value of x and of y .[3]
The students are asked to collect money for charity. In the first month, the students collect x dollars and the students collect y dollars in each subsequent month. In the first 6 months, they collect 7650 dollars. This can be represented by the equation x + 5y = 7650.
In the first 10 months they collect 13 050 dollars.
Calculate the number of months that it will take the students to collect 49 500 dollars.[3]
Answer/Explanation
Markscheme
 (A1)(A1)(A1)(A1)
Notes: Award (A1) for labelled sets T, C, and I included inside an enclosed universal set. (Label U is not essential.) Award (A1) for central entry 40. (A1) for 20, 30 and 35 in the other intersecting regions. (A1) for 60, 110 and 115 or T(150), C(205), I(220).[4 marks]
In parts (b), (c) and (d) follow through from their diagram.
(i) 110 (A1)(ft)
(ii) 35 (A1)(ft) [2 marks]
In parts (b), (c) and (d) follow through from their diagram.
60 (A1)(ft)[2 marks]
In parts (b), (c) and (d) follow through from their diagram.
450 − (60 + 20 + 40 + 30 + 115 + 35 + 110) (M1)
Note: Award (M1) for subtracting all their values from 450.
= 40 (A1)(ft)(G2)[2 marks]
(i) \(\frac{{230}}{{450}} \times \frac{{229}}{{449}}\) (A1)(M1)
Note: Award (A1) for correct fractions, (M1) for multiplying their fractions.
\(\frac{{52670}}{{202050}}\left( {\frac{{5267}}{{20205}},{\text{ 0}}{\text{.261, 26}}{\text{.1% }}} \right)(0.26067…)\) (A1)(G2)
Note: Follow through from their Venn diagram in part (a).
(ii) \(\frac{{220}}{{450}} \times \frac{{230}}{{449}} + \frac{{230}}{{450}} \times \frac{{220}}{{449}}\) (A1)(A1)
Note: Award (A1) for addition of their products, (A1) for two correct products.
OR
\(\frac{{230}}{{450}} \times \frac{{220}}{{449}} \times 2\) (A1)(A1)
Notes: Award (A1) for their product of two fractions multiplied by 2, (A1) for correct product of two fractions multiplied by 2. Award (A0)(A0) if correct product is seen not multiplied by 2.
\(\frac{{2024}}{{4041}}(0.501,{\text{ 50}}{\text{.1% )(0}}{\text{.50086}}…{\text{)}}\) (A1)(G2)
Note: Follow through from their Venn diagram in part (a) and/or their 230 used in part (e)(i).
Note: For consistent use of replacement in parts (i) and (ii) award at most (A0)(M1)(A0) in part (i) and (A1)(ft)(A1)(A1)(ft) in part (ii).[6 marks]
(i) x + 9y = 13050 (A1)
(ii) x = 900 (A1)(ft)
y = 1350 (A1)(ft)
Notes: Follow through from their equation in (f)(i). Do not award (A1)(ft) if answer is negative. Award (M1)(A0) for an attempt at solving simultaneous equations algebraically but incorrect answer obtained.[3 marks]
49500 = 900 + 1350n (A1)(ft)
Notes: Award (A1)(ft) for setting up correct equation. Follow through from candidate’s part (f).
n = 36 (A1)(ft)
The total number of months is 37. (A1)(ft)(G2)
Note: Award (G1) for 36 seen as final answer with no working. The value of n must be a positive integer for the last two (A1)(ft) to be awarded.
OR
49500 = 900 + 1350(n − 1) (A2)(ft)
Notes: Award (A2)(ft) for setting up correct equation. Follow through from candidate’s part (f).
n = 37 (A1)(ft)(G2)
Note: The value of n must be a positive integer for the last (A1)(ft) to be awarded.[3 marks]
Question
100 students at IB College were asked whether they study Music (M), Chemistry (C), or Economics (E) with the following results.
10 study all three
15 study Music and Chemistry
17 study Music and Economics
12 study Chemistry and Economics
11 study Music only
6 study Chemistry only
Draw a Venn diagram to represent the information above.[4]
Write down the number of students who study Music but not Economics.[1]
There are 22 Economics students in total.
(i) Calculate the number of students who study Economics only.
(ii) Find the number of students who study none of these three subjects.[4]
A student is chosen at random from the 100 that were asked above.
Find the probability that this student
(i) studies Economics;
(ii) studies Music and Chemistry but not Economics;
(iii) does not study either Music or Economics;
(iv) does not study Music given that the student does not study Economics.[7]
Answer/Explanation
Markscheme
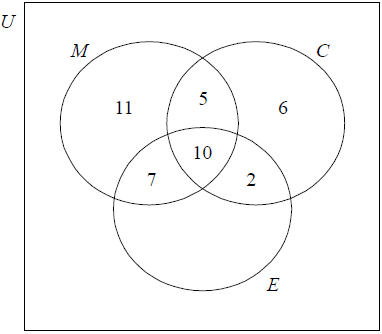
(A1) for rectangle and three labelled circles (U need not be seen)
(A1) for 10 in the correct region
(A1) for 2, 7 and 5 in the correct regions
(A1) for 6 and 11 in the correct regions (A4)
16 (A1)(ft)
Note: Follow through from their Venn diagram.
(i) \(10 + 7 + 2\) (M1)
Note: Award (M1) for summing their 10, 7 and 2.
\(22 – 19\)
\(= 3\) (A1)(ft)(G2)
Note: Follow through from their diagram. Award (M1)(A1)(ft) for answers consistent with their diagram irrespective of whether working seen. Award a maximum of (M1)(A0) for a negative answer.
(ii) \(22 + 11+ 5 + 6\) (M1)
Note: Award (M1) for summing 22, and their 11, 5 and 6.
\(100 – 44\)
\(= 56\) (A1)(ft)(G2)
Note: Follow through from their diagram. Award (M1)(A1)(ft) for answers consistent with their diagram and the use of 22 irrespective of whether working seen. If negative values are used or implied award (M0)(A0).
(i) \(\frac{{22}}{{100}}\left( {\frac{{11}}{{50}},0.22,22\% } \right)\) (A1)(G1)
(ii) \(\frac{{5}}{{100}}\left( {\frac{{1}}{{20}},0.05,5\% } \right)\) (A1)(ft)(A1)(G2)
Note: Award (A1)(ft) for their 5 in numerator, (A1) for denominator.
Follow through from their diagram.
(iii) \(\frac{{62}}{{100}}\left( {\frac{{31}}{{50}},0.62,62\% } \right)\) (A1)(ft)(A1)(G2)
Note: Award (A1)(ft) for \(100 – (22 + 11 + {\text{their }}5)\), (A1) for denominator.
Follow through from their diagram.
(iv) \(\frac{{62}}{{78}}\left( {\frac{{31}}{{39}},0.795,79.5\% } \right)\) (0.794871…) (A1)(ft)(A1)(G2)
Note: Award (A1)(ft) for numerator, (A1) for denominator. Follow
through from part (d)(iii) for numerator.
Question
Forty families were surveyed about the places they went to on the weekend. The places were the circus (C), the museum (M) and the park (P).
16 families went to the circus
22 families went to the museum
14 families went to the park
4 families went to all three places
7 families went to both the circus and the museum, but not the park
3 families went to both the circus and the park, but not the museum
1 family went to the park only
Draw a Venn diagram to represent the given information using sets labelled C, M and P. Complete the diagram to include the number of families represented in each region.[4]
Find the number of families who
(i) went to the circus only;
(ii) went to the museum and the park but not the circus;
(iii) did not go to any of the three places on the weekend.[4]
A family is chosen at random from the group of 40 families. Find the probability that the family went to
(i) the circus;
(ii) two or more places;
(iii) the park or the circus, but not the museum;
(iv) the museum, given that they also went to the circus.[8]
Two families are chosen at random from the group of 40 families.
Find the probability that both families went to the circus.[3]
Answer/Explanation
Markscheme
 (A1)(A1)(A1)(A1)
Award (A1) for 3 intersecting circles and rectangle, (A1) for 1, 3, 4 and 7, (A1) for 2, (A1) for 6 and 5.
(i) 2 (A1)(ft)
(ii) 6 (A1)(ft)
(iii) 40 − (1 + 6 + 2 + 3 + 4 + 7 + 5) (M1)
Note: Award (M1) for subtracting all their values from 40.
= 12 (A1)(ft)(G2)
Note: Follow through from their Venn diagram for parts (i), (ii) and (iii).
(i) \(\frac{{16}}{{40}}\left( {\frac{2}{5},0.4,40\% } \right)\) (A1)(A1)(G2)
Note: Award (A1) for numerator, (A1) for denominator. Answer must be less than 1 otherwise award (A0)(A0). Award (A0)(A0) if answer is given as incorrect reduced fraction without working.
(ii) \(\frac{{20}}{{40}}\left( {\frac{1}{2},0.5,50\% } \right)\) (A1)(ft) (A1) (G2)
Note: Award (A1)(ft) for numerator, (A1) for denominator. Follow through from their Venn diagram. Answer must be less than 1 otherwise award (A0)(A0). Award (A0)(A0) if answer is given as incorrect reduced fraction without working.
(iii) \(\frac{6}{{40}}\left( {\frac{3}{{20}},0.15,15\% } \right)\) (A1)(ft)(A1)(G2)
Note: Award (A1)(ft) for numerator, (A1) for denominator. Follow through from their Venn diagram. Answer must be less than 1 otherwise award (A0)(A0). Award (A0)(A0) if answer is given as incorrect reduced fraction without working.
(iv) \(\frac{{11}}{{16}}\left( {0.6875,68.75\% } \right)\) (A1)(ft)(A1)(G2)
Note: Award (A1)(ft) for numerator, (A1) for denominator. Follow through from their Venn diagram. Answer must be less than 1 otherwise award (A0)(A0). Award (A0)(A0) if answer is given as incorrect reduced fraction without working.
\(\frac{{16}}{{40}} \times \frac{{15}}{{39}}\) (A1)(A1)(ft)
Note: Award (A1) for multiplication of their probabilities, (A1)(ft) for their correct probabilities.
\(\frac{{240}}{{1560}}\left( {\frac{2}{{13}},0.153846…,15.4\% } \right)\) (A1)(ft)(G2)
Note: Follow through from their answer to part (c)(i). Answer must be less than 1 otherwise award at most (A1)(A1)(A0)(ft).
Question
A group of \(120\) women in the USA were asked whether they had visited the continents of Europe (\(E\)) or South America (\(S\)) or Asia (\(A\)).
\(7\) had visited all three continents
\(28\) had visited Europe only
\(22\) had visited South America only
\(16\) had visited Asia only
\(15\) had visited Europe and South America but had not visited Asia
\(x\) had visited South America and Asia but had not visited Europe
\(2x\) had visited Europe and Asia but had not visited South America
\(20\) had not visited any of these continents
Draw a Venn diagram, using sets labelled \(E\), \(S\) and \(A\), to show this information.[5]
Calculate the value of \(x\).[2]
Explain, in words, the meaning of \((E \cup S) \cap A’\).[2]
Write down \(n\left( {(E \cup S \cup A)’} \right)\).[1]
Find the probability that a woman selected at random from the group had visited Europe.[2]
Find the probability that a woman selected at random from the group had visited Europe, given that she had visited Asia.[2]
Two women from the group are selected at random.
Find the probability that both women selected had visited South America.[3]
Answer/Explanation
Markscheme
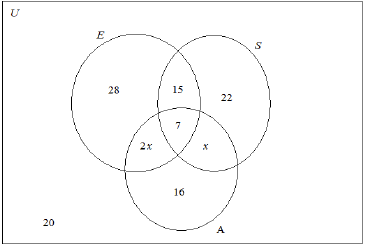 (A1)(A1)(A1)(A1)(A1)
Notes: Award (A1) for rectangle and three labelled intersecting circles.
Award (A1) for \(7\) in correct place.
Award (A1) for \(28\), \(22\) and \(16\) in the correct places.
Award (A1) for \(15\), \(x\) and \(2x\) in the correct places.
Award (A1) for \(20\) in the correct place.
Accept \(4\) and \(8\) instead of \(x\) and \(2x\).
Do not penalize if \(U\) is omitted from the diagram.[5 marks]
\(3x = 120 – (20 + 28 + 15 + 22 + 7 + 16)\) (M1)
Note: Award (M1) for setting up a correct equation involving \(x\), the \(120\) and values from their diagram.
\(x = 4\) (A1)(ft)(G2)
Note: Follow through from part (a). For the follow through to be awarded \(x\) must be a positive integer.[2 marks]
(Women who had visited) Europe or South America and (but had) not (visited) Asia (A1)(A1)
Notes: Award (A1) for “(visited) Europe or South America” (or both).
Award (A1) for “and (but) had not visited Asia”.
\(E\)(urope) union \(S\)(outh America) intersected with not \(A\)(sia) earns no marks, (A0).[2 marks]
\(20\) (A1)
Note: Award (A0) for the embedded answer of \(n(20)\).[1 mark]
\(\frac{{58}}{{120}}{\text{ }}\left( {\frac{{29}}{{60}},{\text{ 0.483, 48.3% }}} \right){\text{ (0.48333}} \ldots {\text{)}}\) (A1)(ft)(A1)(G2)
Note: Award (A1)(ft) for numerator, follow through from their value of \(x\), or their diagram, (A1) for denominator.[2 marks]
\(\frac{{15}}{{35}}{\text{ }}\left( {\frac{3}{7},{\text{ 0.429, 42.9% }}} \right){\text{ (0.428571}} \ldots {\text{)}}\) (A1)(ft)(A1)(ft)(G2)
Note: Award (A1)(ft) for numerator, (A1)(ft) for denominator, follow through from their value of \(x\) or their diagram. [2 marks]
\(\frac{{48}}{{120}} \times \frac{{47}}{{119}}\) (A1)(ft)(M1)
Notes: Award (A1)(ft) for two correct fractions, follow through from their denominator in part (e), follow through the numerator from their answer to part (b) or from their diagram, (M1) for multiplication of their two fractions.
\( = \frac{{2256}}{{14\,280}}\left( {\frac{{94}}{{595}},{\text{ 0.158, 15,8% }}} \right){\text{ (0.157983}} \ldots {\text{)}}\) (A1)(ft)(G2)
Notes: Award (A1)(M1)(A1) for correct fractions, correctly multiplied together with an answer of \(0.16\).
Award (A0)(M1)(A0) for \(\frac{{48}}{{120}} \times \frac{{48}}{{120}} = 0.16\).
Award (G1) for an answer of \(0.16\) with no working seen.[3 marks]
Question
A group of tourists went on safari to a game reserve. The game warden wanted to know how many of the tourists saw Leopard (\(L\)), Cheetah (\(C\)) or Rhino (\(R\)). The results are given as follows.
5 of the tourists saw all three
7 saw Leopard and Rhino
1 saw Cheetah and Leopard but not Rhino
4 saw Leopard only
3 saw Cheetah only
9 saw Rhino only
Draw a Venn diagram to show this information.[4]
There were 25 tourists in the group and every tourist saw at least one of the three types of animal.
Find the number of tourists that saw Cheetah and Rhino but not Leopard.[2]
There were 25 tourists in the group and every tourist saw at least one of the three types of animal.
Calculate the probability that a tourist chosen at random from the group
(i) saw Leopard;
(ii) saw only one of the three types of animal;
(iii) saw only Leopard, given that he saw only one of the three types of animal.[6]
There were 25 tourists in the group and every tourist saw at least one of the three types of animal.
If a tourist chosen at random from the group saw Leopard, find the probability that he also saw Cheetah.[2]
Answer/Explanation
Markscheme
 (A1)(A1)(A1)(A1)
Note: Award (A1) for rectangle and three labelled intersecting circles (the rectangle need not be labelled), (A1) for 5, (A1) for 2 and 1, (A1) for 4, 3 and 9.[4 marks]
\(25 – (5 + 2 + 1 + 4 + 3 + 9)\) (M1)
Notes: Award (M1) for their \(5 + 2 + 1 + 4 + 3 + 9\) seen even if total is greater than \(25\).
Do not award (A1)(ft) if their total is greater than \(25\).
\( = 1\) (A1)(ft)(G2)[2 marks]
(i) \(\frac{{12}}{{25}}{\text{ }}(0.48,{\text{ }}48\% )\) (A1)(ft)(A1)(G2)
Notes: Award (A1)(ft) for numerator, (A1) for denominator.
Follow through from Venn diagram.
(ii) \(\frac{{16}}{{25}}{\text{ }}(0.64,{\text{ }}64\% )\) (A1)(A1)(G2)
Notes: Award (A1) for numerator, (A1) for denominator.
There is no follow through; all information is given.
(iii) \(\frac{4}{{16}}{\text{ }}(0.25,{\text{ }}25\% )\)) (A1)(A1)(ft)(G2)
Notes: Award (A1) for numerator, (A1)(ft) for denominator.
Follow through from part (c)(ii) only.[6 marks]
\(\frac{6}{{12}}{\text{ }}(0.5,{\text{ }}50\% )\) (A1)(A1)(ft)(G2)
Notes: Award (A1) for numerator, (A1)(ft) for denominator.
Follow through from Venn diagram.[2 marks]
Question
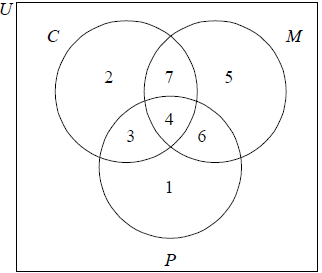
A group of 100 customers in a restaurant are asked which fruits they like from a choice of mangoes, bananas and kiwi fruits. The results are as follows.
15 like all three fruits
22 like mangoes and bananas
33 like mangoes and kiwi fruits
27 like bananas and kiwi fruits
8 like none of these three fruits
\(x\) like only mangoes
Copy the following Venn diagram and correctly insert all values from the above information.
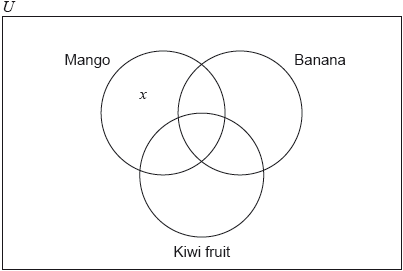 [3]
[3]
The number of customers that like only mangoes is equal to the number of customers that like only kiwi fruits. This number is half of the number of customers that like only bananas.
Complete your Venn diagram from part (a) with this additional information in terms of \(x\).[2]
The number of customers that like only mangoes is equal to the number of customers that like only kiwi fruits. This number is half of the number of customers that like only bananas.
Find the value of \(x\).[2]
The number of customers that like only mangoes is equal to the number of customers that like only kiwi fruits. This number is half of the number of customers that like only bananas.
Write down the number of customers who like
(i) mangoes;
(ii) mangoes or bananas.[2]
The number of customers that like only mangoes is equal to the number of customers that like only kiwi fruits. This number is half of the number of customers that like only bananas.
A customer is chosen at random from the 100 customers. Find the probability that this customer
(i) likes none of the three fruits;
(ii) likes only two of the fruits;
(iii) likes all three fruits given that the customer likes mangoes and bananas.[4]
The number of customers that like only mangoes is equal to the number of customers that like only kiwi fruits. This number is half of the number of customers that like only bananas.
Two customers are chosen at random from the 100 customers. Find the probability that the two customers like none of the three fruits.[3]
Answer/Explanation
Markscheme
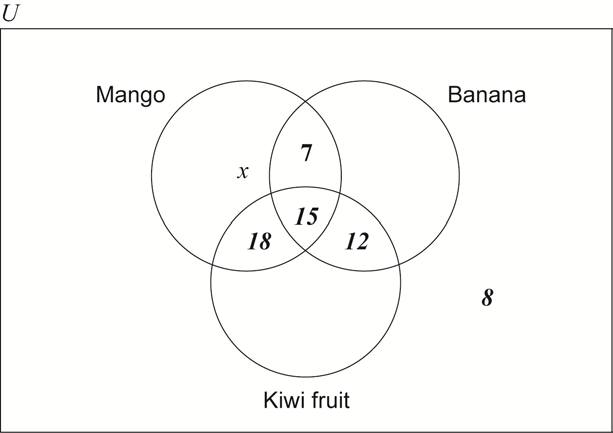 (A1)(A1)(A1)
Notes: Award (A1) for 15 in the correct place.
Award (A1) for 7, 18 and 12 seen in the correct places.
Award (A1) for 8 in the correct place.
Award at most (A0)(A1)(A1) if diagram is missing the rectangle.
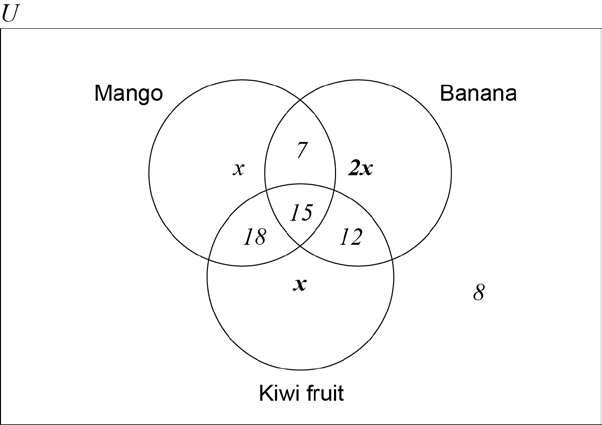 (A1)(A1)
Notes: Award (A1) for \(x\) seen in the correct places.
Award (A1) for \(2x\) seen in the correct place.
Award (A0)(A1)(ft) if \(x\) and \(2x\) are replaced by 10 and 20 respectively.
\(2x + x + x + 15 + 8 + 7 + 18 + 12 = 100\;\;\;(4x + 60 = 100{\text{ or equivalent)}}\) (M1)
Note: Award (M1) for equating the sum of the elements of their Venn diagram to \(100\). Equating to \(100\) may be implied.
\((x = ){\text{ }}10\) (A1)(ft)(G2)
Note: Follow through from their Venn diagram. The answer must be a positive integer.
(i) \(50\) (A1)(ft)
(ii) \(82\) (A1)(ft)
Note: Follow through from their answer to part (c) and their Venn diagram.
Award (A0)(ft)(A1)(ft) if answer is \(\frac{{50}}{{100}}\) and \(\frac{{82}}{{100}}\).
(i) \(\frac{8}{{100}}\;\;\;\left( {\frac{2}{{25}};{\text{ }}0.08;{\text{ }}8\% } \right)\) (A1)
Note: Correct answer only. There is no follow through.
(ii) \(\frac{{37}}{{100}}\;\;\;(0.37,{\text{ }}37\% )\) (A1)(ft)
Note: Follow through from their Venn diagram.
(iii) \(\frac{{15}}{{22}}\;\;\;(0.681;{\text{ }}0.682;{\text{ }}68.2\% )\;\;\;(0.681818 \ldots )\) (A1)(A1)(ft)(G2)
Notes: Award (A1) for numerator, (A1)(ft) for denominator, follow through from their Venn diagram. Award (A0)(A0) if answer is given as incorrect reduced fraction without working.
\(\frac{8}{{100}} \times \frac{7}{{99}}\) (A1)(ft)(M1)
Note: Award (A1)(ft) for correct fractions, follow through from their answer to part (e)(i), (M1) for multiplying their fractions.
\( = \frac{{56}}{{9900}}\;\;\;\left( {\frac{{14}}{{2477}},{\text{ }}0.00565656 \ldots ,{\text{ }}0.00566,{\text{ }}0.0056,{\text{ }}0.566\% } \right)\) (A1)(ft)(G2)
Question
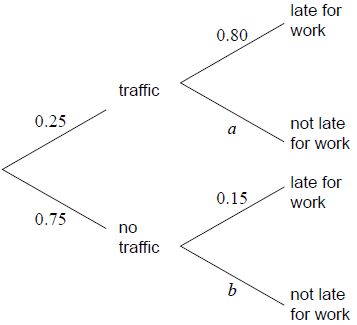
In a company it is found that 25 % of the employees encountered traffic on their way to work. From those who encountered traffic the probability of being late for work is 80 %.
From those who did not encounter traffic, the probability of being late for work is 15 %.
The tree diagram illustrates the information.
The company investigates the different means of transport used by their employees in the past year to travel to work. It was found that the three most common means of transport used to travel to work were public transportation (P ), car (C ) and bicycle (B ).
The company finds that 20 employees travelled by car, 28 travelled by bicycle and 19 travelled by public transportation in the last year.
Some of the information is shown in the Venn diagram.
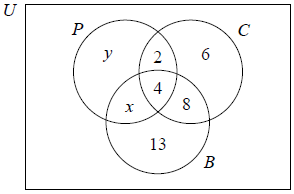
There are 54 employees in the company.
Write down the value of a.[1]
Write down the value of b.[1]
Use the tree diagram to find the probability that an employee encountered traffic and was late for work.[2]
Use the tree diagram to find the probability that an employee was late for work.[3]
Use the tree diagram to find the probability that an employee encountered traffic given that they were late for work.[3]
Find the value of x.[1]
Find the value of y.[1]
Find the number of employees who, in the last year, did not travel to work by car, bicycle or public transportation.[2]
Find \(n\left( {\left( {C \cup B} \right) \cap P’} \right)\).[2]
Answer/Explanation
Markscheme
a = 0.2 (A1)[1 mark]
b = 0.85 (A1)[1 mark]
0.25 × 0.8 (M1)
Note: Award (M1) for a correct product.
\( = 0.2\,\,\,\left( {\,\frac{1}{5},\,\,\,20\% } \right)\) (A1)(G2)[2 marks]
0.25 × 0.8 + 0.75 × 0.15 (A1)(ft)(M1)
Note: Award (A1)(ft) for their (0.25 × 0.8) and (0.75 × 0.15), (M1) for adding two products.
\( = 0.313\,\,\,\left( {0.3125,\,\,\,\frac{5}{{16}},\,\,\,31.3\% } \right)\) (A1)(ft)(G3)
Note: Award the final (A1)(ft) only if answer does not exceed 1. Follow through from part (b)(i).[3 marks
\(\frac{{0.25 \times 0.8}}{{0.25 \times 0.8 + 0.75 \times 0.15}}\) (A1)(ft)(A1)(ft)
Note: Award (A1)(ft) for a correct numerator (their part (b)(i)), (A1)(ft) for a correct denominator (their part (b)(ii)). Follow through from parts (b)(i) and (b)(ii).
\( = 0.64\,\,\,\left( {\frac{{16}}{{25}},\,\,64{\text{% }}} \right)\) (A1)(ft)(G3)
Note: Award final (A1)(ft) only if answer does not exceed 1.[3 marks]
(x =) 3 (A1)[1 Mark]
(y =) 10 (A1)(ft)
Note: Following through from part (c)(i) but only if their x is less than or equal to 13.[1 Mark]
54 − (10 + 3 + 4 + 2 + 6 + 8 + 13) (M1)
Note: Award (M1) for subtracting their correct sum from 54. Follow through from their part (c).
= 8 (A1)(ft)(G2)
Note: Award (A1)(ft) only if their sum does not exceed 54. Follow through from their part (c).[2 marks]
6 + 8 + 13 (M1)
Note: Award (M1) for summing 6, 8 and 13.
27 (A1)(G2)[2 marks]
Question
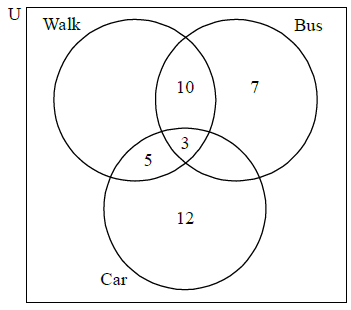
\(50\) students at Rambling High School were asked how they travelled to school yesterday. All of the students travelled by bus, by car or walked.
\(12\) students travelled by car only
\(7\) students travelled by bus only
\(5\) students travelled by car and walked, but did not use a bus
\(10\) students travelled by bus and walked, but did not use a car
\(3\) students used all three forms of travel.
Represent this information on a Venn Diagram.[4]
There were \(28\) students who used a bus to travel to school. Calculate the number of students
(i) who travelled by car and by bus but did not walk;
(ii) who travelled by car.[4]
Tomoko used a bus to travel to school yesterday.
Find the probability that she also walked.[2]
Two students are chosen at random from all \(50\) students.
Find the probability that
(i) both students walked;
(ii) only one of the students walked.[7]
Answer/Explanation
Markscheme
 (A4)
(A4)
Note: Award (A1) for rectangle and three labelled intersecting circles, (A1) for \(3\), (A1) for \(5\) and \(10\), (A1) for \(7\) and \(12\).
(i) \(28 – (10 + 3 + 7) = 8\) (M1)(A1)(ft)(G2)
Note: Follow through from their Venn diagram.
(ii) \(5 + 3 + 8 + 12 = 28\) (M1)(A1)(ft)(G2)
Note: Follow through from part (b)(i) and their Venn diagram.
\({\text{P(}}\left. {{\text{walk}}} \right|{\text{bus}}) = \frac{{13}}{{28}}\) \((0.464{\text{, }}46.4\% )\) (\(0.464285 \ldots \)) (A1)(A1)(ft)(G2)
Note: Award (A1)(ft) for the numerator, (A1) for denominator.
(i) \(\frac{{23}}{{50}} \times \frac{{22}}{{49}}\) (A1)(M1)(M1)
Note: Award (A1) for \(23\) seen, (M1) for non replacement, (M1) for multiplying their fractions.
\( = \frac{{506}}{{2450}}\) \((0.207{\text{, }}20.7\% )\) (\(0.206530 \ldots \)) (A1)(G3)
(ii) \(\frac{{23}}{{50}} \times \frac{{27}}{{49}} + \frac{{27}}{{50}} \times \frac{{23}}{{49}}\) (A1)(ft)(M1)
Notes: Award (A1)(ft) for two products, (M1) for adding two products. Do not penalise in (ii) for consistent use of with replacement.
\( = \frac{{1242}}{{2450}}\) \((0.507{\text{, }}50.7\% )\) (\(0.509638 \ldots \)) (A1)(ft)(G2)