Question
The figure below shows the lengths in centimetres of fish found in the net of a small trawler.
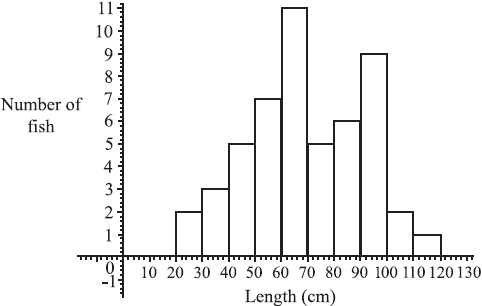
Find the total number of fish in the net.[2]
Find (i) the modal length interval,
(ii) the interval containing the median length,
(iii) an estimate of the mean length.[5]
(i) Write down an estimate for the standard deviation of the lengths.
(ii) How many fish (if any) have length greater than three standard deviations above the mean?[3]
The fishing company must pay a fine if more than 10% of the catch have lengths less than 40cm.
Do a calculation to decide whether the company is fined.[2]
A sample of 15 of the fish was weighed. The weight, W was plotted against length, L as shown below.
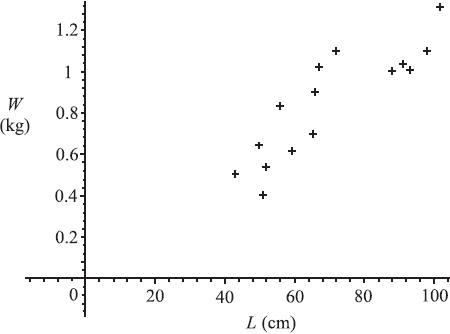
Exactly two of the following statements about the plot could be correct. Identify the two correct statements.
Note: You do not need to enter data in a GDC or to calculate r exactly.
(i) The value of r, the correlation coefficient, is approximately 0.871.
(ii) There is an exact linear relation between W and L.
(iii) The line of regression of W on L has equation W = 0.012L + 0.008 .
(iv) There is negative correlation between the length and weight.
(v) The value of r, the correlation coefficient, is approximately 0.998.
(vi) The line of regression of W on L has equation W = 63.5L + 16.5.[2]
Answer/Explanation
Markscheme
Total = 2 + 3 + 5 + 7 + 11 + 5 + 6 + 9 + 2 + 1 (M1)
(M1) is for a sum of frequencies.
= 51 (A1)(G2)[2 marks]
Unit penalty (UP) is applicable where indicated in the left hand column.
(i) modal interval is 60 – 70
Award (A0) for 65 (A1)
(ii) median is length of fish no. 26, (M1)(A1)
also 60 – 70 (G2)
Can award (A1)(ft) or (G2)(ft) for 65 if (A0) was awarded for 65 in part (i).
(iii) mean is \(\frac{{2 \times 25 + 3 \times 35 + 5 \times 45 + 7 \times 55 + …}}{{51}}\) (M1)
(UP) = 69.5 cm (3sf) (A1)(ft)(G1)
Note: (M1) is for a sum of (frequencies multiplied by midpoint values) divided by candidate’s answer from part (a). Accept mid-points 25.5, 35.5 etc or 24.5, 34.5 etc, leading to answers 70.0 or 69.0 (3sf) respectively. Answers of 69.0, 69.5 or 70.0 (3sf) with no working can be awarded (G1).[5 marks]
Unit penalty (UP) is applicable where indicated in the left hand column.
(UP) (i) standard deviation is 21.8 cm (G1)
For any other answer without working, award (G0). If working is present then (G0)(AP) is possible.
(ii) \(69.5 + 3 \times 21.8 = 134.9 > 120\) (M1)
no fish (A1)(ft)(G1)
For ‘no fish’ without working, award (G1) regardless of answer to (c)(i). Follow through from (c)(i) only if method is shown.[3 marks]
5 fish are less than 40 cm in length, (M1)
Award (M1) for any of \(\frac{5}{51}\), \(\frac{46}{51}\), 0.098 or 9.8%, 0.902, 90.2% or 5.1 seen.
hence no fine. (A1)(ft)
Note: There is no G mark here and (M0)(A1) is never allowed. The follow-through is from answer in part (a).[2 marks]
(i) and (iii) are correct. (A1)(A1)[2 marks]
Question
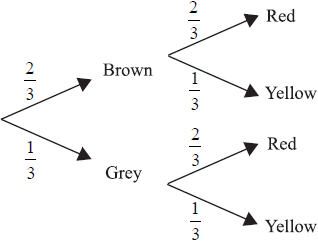
Neil has three dogs. Two are brown and one is grey. When he feeds the dogs, Neil uses three bowls and gives them out randomly. There are two red bowls and one yellow bowl. This information is shown on the tree diagram below.
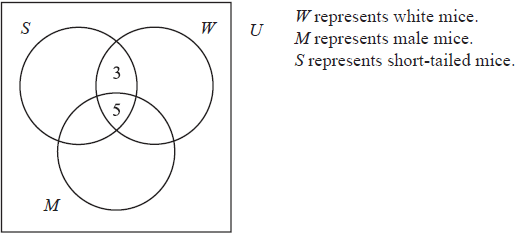
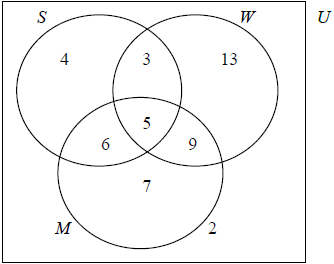
There are 49 mice in a pet shop.
30 mice are white.
27 mice are male.
18 mice have short tails.
8 mice are white and have short tails.
11 mice are male and have short tails.
7 mice are male but neither white nor short-tailed.
5 mice have all three characteristics and
2 have none.
Copy the diagram below to your examination script.
One of the dogs is chosen at random.
(i) Find P (the dog is grey and has the yellow bowl).
(ii) Find P (the dog does not get the yellow bowl).[3]
Neil often takes the dogs to the park after they have eaten. He has noticed that the grey dog plays with a stick for a quarter of the time and both brown dogs play with sticks for half of the time. This information is shown on the tree diagram below.
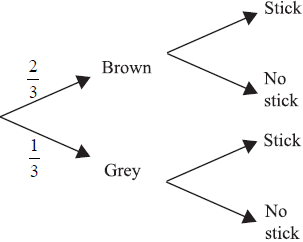
(i) Copy the tree diagram and add the four missing probability values on the branches that refer to playing with a stick.
During a trip to the park, one of the dogs is chosen at random.
(ii) Find P (the dog is grey or is playing with a stick, but not both).
(iii) Find P (the dog is grey given that the dog is playing with a stick).
(iv) Find P (the dog is grey and was fed from the yellow bowl and is not playing with a stick).[9]
Complete the diagram, using the information given in the question.[4]
Find (i) \(n(M \cap W)\)
(ii) \(n(M′ \cup S)\)[3]
Two mice are chosen without replacement.
Find P (both mice are short-tailed).[2]
Answer/Explanation
Markscheme
(i) P (a dog is grey and has the yellow bowl)
\( = \frac{1}{3} \times \frac{1}{3} = \frac{1}{9}( = 0.111)\) (M1)(A1)(G2)
The (M1) is for multiplying two values along any branch of the tree.(ii) P (dog does not get yellow bowl) \( = \frac{2}{3}\) ( = 0.667 (3sf) or 0.6) (A1)[3 marks]
(i) The tree diagram should show the values \(\frac{1}{2},\frac{1}{2}\) for the brown branch and \(\frac{1}{4},\frac{3}{4}\) in the correct positions for the grey branch. (A1)(A1)(ft)
Follow through if the branches are interchanged.
(ii) P (the dog is grey or is playing with a stick, but not both)
\( = \frac{1}{3} \times \frac{3}{4} + \frac{2}{3} \times \frac{1}{2}\) (M1)
\( = \frac{7}{{12}}\) ( = 0.583) (A1)(ft)(G1)
The (M1) is for showing two correct products (whether added or not). Follow through from b(i). Award (M1) for \( \frac{1}{3} + \frac{1}{4}\) (must be a sum).
(iii) P (dog is grey given that it is playing with stick)
\(\frac{{P(G \cap S)}}{{P(S)}} = \frac{{\frac{1}{3} \times \frac{1}{4}}}{{\left( {\frac{2}{3} \times \frac{1}{2}} \right) + \left( {\frac{1}{3} \times \frac{1}{4}} \right)}}\) or \(\frac{1}{{12}}/\frac{5}{{12}}\) (M1)(A1)(ft)
(M1) for substituted conditional probability formula, (A1) for correct substitutions.
\( = \frac{1}{5}\) ( = 0.2) (A1)(ft)(G2)
(iv) P (grey and fed from yellow bowl and not playing with stick) \( = \frac{1}{3} \times \frac{1}{3} \times \frac{3}{4} = \frac{1}{{12}}\) ( = \(\frac{3}{{36}}\) = 0.0833 3sf). (M1)(A1)(ft)(G1)
(M1) is for product of 3 reasonable probability values. [9 marks]
 (A1)(A1)(A1)(ft)(A1)(ft)
Award (A1) for 2 (must be in a box), (A1) for 7, (A1)(ft) for 6 and 4, (A1)(ft) for 9 and 13. Observe the assignment of (ft) marks strictly here. Example A common error is likely to be 11 instead of 6 (A0). In this case follow through to 4 and 18 (A1)(ft) for the final pair. Here the 4 follows from the total of 27 for n(M).[4 marks]
(i) \(n(M \cap W) = 14\) (A1)(ft)
(ii) \(n(M’ \cup S) = 22 + 11\) OR \(15 + 18\) (A1)(ft)
= 33 (A1)(ft)
Award (A2) if answer 33 is seen. Award (A1) for any of 22, 11, 15 or 18 seen but 33 absent.[3 marks]
P (both mice short-tailed) \( = \frac{{18}}{{49}} \times \frac{{17}}{{48}} = \frac{{306}}{{352}}\) (= 0.130). (M1)(A1)(ft)(G1)
(Allow alternatives such as 153/1176 or 51/392.) Award (M1) for any of \(\frac{{18}}{{49}}\) and \(\frac{{17}}{{48}}\) or \(\frac{{18}}{{49}} \times \frac{{17}}{{49}}\) or \(\frac{{18}}{{49}} + \frac{{17}}{{48}}\) seen.[2 marks]
Question
When Geraldine travels to work she can travel either by car (C), bus (B) or train (T). She travels by car on one day in five. She uses the bus 50 % of the time. The probabilities of her being late (L) when travelling by car, bus or train are 0.05, 0.12 and 0.08 respectively.
It is not necessary to use graph paper for this question.
Copy the tree diagram below and fill in all the probabilities, where NL represents not late, to represent this information.
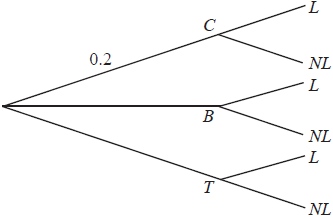 [5]
[5]
Find the probability that Geraldine travels by bus and is late.[1]
Find the probability that Geraldine is late.[3]
Find the probability that Geraldine travelled by train, given that she is late.[3]
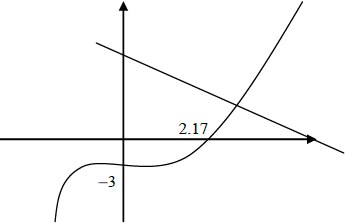
Sketch the curve of the function \(f (x) = x^3 − 2x^2 + x − 3\) for values of \(x\) from −2 to 4, giving the intercepts with both axes.[3]
On the same diagram, sketch the line \(y = 7 − 2x\) and find the coordinates of the point of intersection of the line with the curve.[3]
Find the value of the gradient of the curve where \(x = 1.7\) .[2]
Answer/Explanation
Markscheme
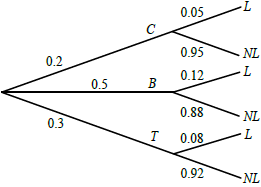
Award (A1) for 0.5 at B, (A1) for 0.3 at T, then (A1) for each correct pair. Accept fractions or percentages. (A5)[5 marks]
0.06 (accept \(0.5 \times 0.12\) or 6%) (A1)(ft)[1 mark]
for a relevant two-factor product, either \(C \times L\) or \(T \times L\) (M1)
for summing three two-factor products (M1)
\((0.2 \times 0.05 + 0.06 + 0.3 \times 0.08)\)
0.094 (A1)(ft)(G2)[3 marks]
\(\frac{{0.3 \times 0.08}}{{0.094}}\) (M1)(A1)(ft)
award (M1) for substituted conditional probability formula seen, (A1)(ft) for correct substitution
= 0.255 (A1)(ft)(G2)[3 marks]
 (G3)[3 marks]
line drawn with –ve gradient and +ve y-intercept (G1)
(2.45, 2.11) (G1)(G1)[3 marks]
\(f ‘ (1.7) = 3(1.7)^2 – 4(1.7) + 1\) (M1)
award (M1) for substituting in their \(f’ (x)\)
2.87 (A1)(G2)[2 marks]
Question
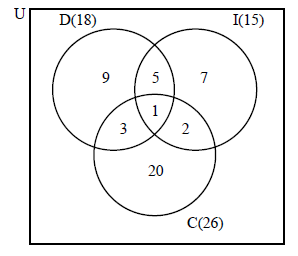
A group of 50 students completed a questionnaire for a Mathematical Studies project. The following data was collected.
\(18\) students own a digital camera (D)
\(15\) students own an iPod (I)
\(26\) students own a cell phone (C)
\(1\) student owns all three items
\(5\) students own a digital camera and an iPod but not a cell phone
\(2\) students own a cell phone and an iPod but not a digital camera
\(3\) students own a cell phone and a digital camera but not an iPod
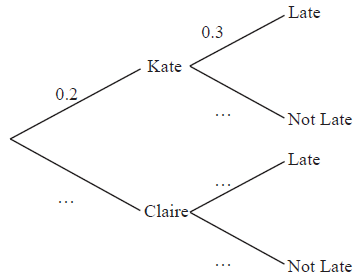
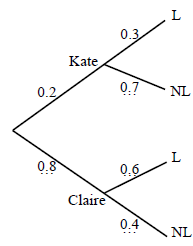
Claire and Kate both wish to go to the cinema but one of them has to stay at home to baby-sit.
The probability that Kate goes to the cinema is \(0.2\). If Kate does not go Claire goes.
If Kate goes to the cinema the probability that she is late home is \(0.3\).
If Claire goes to the cinema the probability that she is late home is \(0.6\).
Represent this information on a Venn diagram.[4]
Calculate the number of students who own none of the items mentioned above.[2]
If a student is chosen at random, write down the probability that the student owns a digital camera only.[1]
If two students are chosen at random, calculate the probability that they both own a cell phone only.[3]
If a student owns an iPod, write down the probability that the student also owns a digital camera.[2]
Copy and complete the probability tree diagram below.
 [3]
[3]
Calculate the probability that
(i) Kate goes to the cinema and is not late;
(ii) the person who goes to the cinema arrives home late.[5]
Answer/Explanation
Markscheme
 (A1)(A1)(A1)(A1)(ft)
Note: (A1) for rectangle with 3 intersecting circles, (A1) for \(1\), (A1) for \(5\), \(3\), \(2\), (A1)(ft) for \(9\), \(7\), \(20\) if subtraction is carried out, or \(18\), \(15\), \(26\) seen by the letters D, I and C.[4 marks]
\(50 – 47\) (M1)
Note: (M1) for subtracting their value from \(50\).
\( = 3\) (A1)(ft)(G2)[2 marks]
\(\frac{9}{{50}}\) (A1)(ft)[1 mark]
\(\frac{{20}}{{50}} \times \frac{{19}}{{49}}\) (A1)(ft)(M1)
\( = \frac{{38}}{{245}}{\text{ }}\left( {\frac{{380}}{{2450}}{\text{, }}0.155{\text{, }}15.5\% } \right)\) (A1)(ft)(G2)
Notes: (A1)(ft) for correct fractions from their Venn diagram
(M1) for multiplying their fractions
(A1)(ft) for correct answer.[3 marks]
\(\frac{6}{{15}}{\text{ }}\left( {\frac{2}{5}{\text{, }}0.4{\text{, }}40\% } \right)\) (A1)(ft)(A1)(ft)
Note: (A1)(ft) for numerator, (A1)(ft) denominator.[2 marks]
 (A1)(A1)(A1)
Note: (A1) for \(0.8\), (A1) for \(0.7\), (A1) for \(0.6\) and \(0.4\).[3 marks]
(i) \(0.2 \times 0.7 = 0.14\) (M1)(A1)(ft)(G2)
Note: (M1) for multiplying correct numbers.[2 marks]
(ii) \(0.2 \times 0.3 + 0.8 \times 0.6\) (M1)(M1)
\( = 0.54\) (A1)(ft)(G3)
Note: (M1) for each correct product (use candidate’s tree), (A1)(ft) for answer.[3 marks]
Question
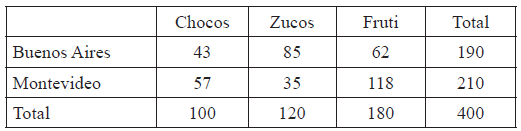
A survey of \(400\) people is carried out by a market research organization in two different cities, Buenos Aires and Montevideo. The people are asked which brand of cereal they prefer out of Chocos, Zucos or Fruti. The table below summarizes their responses.
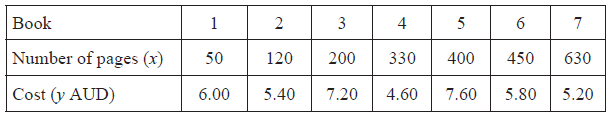
The following table shows the cost in \({\text{AUD}}\) of seven paperback books chosen at random, together with the number of pages in each book.
One person is chosen at random from those surveyed. Find the probability that this person
(i) does not prefer Zucos;
(ii) prefers Chocos, given that they live in Montevideo.[4]
Two people are chosen at random from those surveyed. Find the probability that they both prefer Fruti.[3]
The market research organization tests the survey data to determine whether the brand of cereal preferred is associated with a city. A chi-squared test at the \(5\% \) level of significance is performed.
State the null hypothesis.[1]
The market research organization tests the survey data to determine whether the brand of cereal preferred is associated with a city. A chi-squared test at the \(5\% \) level of significance is performed.
State the number of degrees of freedom.[1]
The market research organization tests the survey data to determine whether the brand of cereal preferred is associated with a city. A chi-squared test at the \(5\% \) level of significance is performed.
Show that the expected frequency for the number of people who live in Montevideo and prefer Zucos is \(63\).[2]
The market research organization tests the survey data to determine whether the brand of cereal preferred is associated with a city. A chi-squared test at the \(5\% \) level of significance is performed.
Write down the chi-squared statistic for this data.[2]
The market research organization tests the survey data to determine whether the brand of cereal preferred is associated with a city. A chi-squared test at the \(5\% \) level of significance is performed.
State whether the market research organization would accept the null hypothesis. Clearly justify your answer.[2]
Plot these pairs of values on a scatter diagram. Use a scale of \(1{\text{ cm}}\) to represent \(50\) pages on the horizontal axis and \(1{\text{ cm}}\) to represent \(1{\text{ AUD}}\) on the vertical axis.[3]
Write down the linear correlation coefficient, \(r\), for the data.[2]
Stephen wishes to buy a paperback book which has \(350\) pages in it. He plans to draw a line of best fit to determine the price. State whether or not this is an appropriate method in this case and justify your answer.[2]
Answer/Explanation
Markscheme
(i) \(\frac{{280}}{{400}}{\text{ }}(0.7{\text{, }}70\% {\text{ or equivalent}})\) (A1)(A1)(G2)
Note: (A1) for correct numerator, (A1) for correct denominator.
(ii) \(\frac{{57}}{{210}}{\text{ }}\left( {\frac{{19}}{{70}}{\text{, }}0.271{\text{, }}27.1\% } \right)\) (A1)(A1)(G2)
Note: (A1) for correct numerator, (A1) for correct denominator.[4 marks]
\(\frac{{180}}{{400}} \times \frac{{179}}{{399}}\) (A1)(M1)
Note: (A1) for correct values seen, (M1) for multiplying their two values, (A1) for correct answer.
\( = \frac{{537}}{{2660}}{\text{ }}( = 0.202)\) (A1)(G3)[3 marks]
\({{\text{H}}_0}\) : ‘the preference of brand of cereal is independent of the city’. (A1)
OR
\({{\text{H}}_0}\) : ‘there is no association between the brand of cereal and city’.[1 mark]
\(df = 2\) (A1)[1 mark]
\(\frac{{210 \times 120}}{{400}}\) (M1)(A1)
Note: (M1) for substituting in correct formula, (A1) for correct values.
\( = 63\) (AG)
Note: Final line must be seen or previous (A1) mark is lost.[2 marks]
\(39.3\) (G2)
Note: Award (G1)(A0)(AP) if answers not to 3 significant figures.[2 marks]
\(p – {\text{value}} < 0.05\) (R1)(ft)
Do not accept \({{{\text{H}}_0}}\) . (A1)(ft)
Notes: Allow ‘Reject \({{{\text{H}}_0}}\) or equivalent’. (ft) from their \({\chi ^2}\) statistic.
Award (R1)(ft) for comparing the appropriate values. (A1)(ft) can be awarded only if the conclusion is valid according to the comparison given. If no reason given or if reason is wrong both marks are lost. Note that (R1)(A0)(ft) can be awarded but (R0)(A1)(ft) cannot.[2 marks]
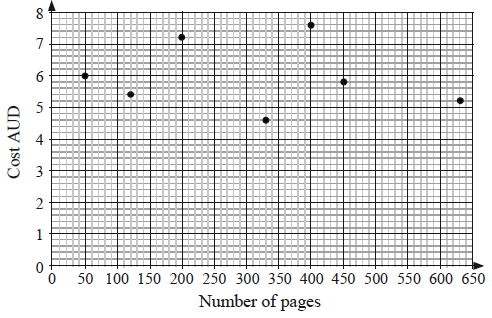 (A1)(A1)(A1)
Notes: (A1) for label and scales, (A2) for all points correct, (A1) for 5 or 6 correct. Award a maximum of (A2) if points are joined.[3 marks]
\(r = – 0.141\) (G2)
Note: If negative sign is missing award (G1)(G0).[2 marks]
‘The coefficient of correlation is too low, (very) weak (linear) relationship’. (R1)
Not a sensible thing to do, accept ‘no’. (A1)
Note: Do not award (R0)(A1). The correlation coefficient has to be mentioned in their reasoning.[2 marks]
Question
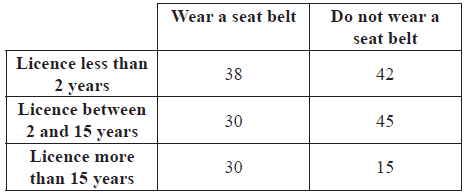
Jorge conducted a survey of \(200\) drivers. He asked two questions:
How long have you had your driving licence?
Do you wear a seat belt when driving?
The replies are summarized in the table below.
Jorge applies a \({\chi ^2}\) test at the \(5\% \) level to investigate whether wearing a seat belt is associated with the time a driver has had their licence.
(i) Write down the null hypothesis, \({{\text{H}}_0}\).
(ii) Write down the number of degrees of freedom.
(iii) Show that the expected number of drivers that wear a seat belt and have had their driving licence for more than \(15\) years is \(22\), correct to the nearest whole number.
(iv) Write down the \({\chi ^2}\) test statistic for this data.
(v) Does Jorge accept \({{\text{H}}_0}\) ? Give a reason for your answer.[8]
Consider the \(200\) drivers surveyed. One driver is chosen at random. Calculate the probability that
(i) this driver wears a seat belt;
(ii) the driver does not wear a seat belt, given that the driver has held a licence for more than \(15\) years.[4]
Two drivers are chosen at random. Calculate the probability that
(i) both wear a seat belt.
(ii) at least one wears a seat belt.[6]
Answer/Explanation
Markscheme
(i) \({{\text{H}}_0} = \) wearing of a seat belt and the time a driver has held a licence are independent. (A1)
Note: For independent accept ‘not associated’ but do not accept ‘not related’ or ‘not correlated’
(ii) \(2\) (A1)
(iii) \(\frac{{98 \times 45}}{{200}} = 22.05 = 22\) (correct to the nearest whole number) (M1)(A1)(AG)
Note: (M1) for correct formula and (A1) for correct substitution. Unrounded answer must be seen for the (A1) to be awarded.
(iv) \({\chi ^2} = 8.12\) (G2)
Note: For unrounded answer award (G1)(G0)(AP). If formula used award (M1) for correct substituted formula with correct substitution (6 terms) (A1) for correct answer.
(v) “Does not accept \({{\text{H}}_0}\)” (A1)(ft)
\(p{\text{-}}value < 0.05\) (R1)(ft)
Note: Allow “Reject \({{\text{H}}_0}\)” or equivalent. Follow through from their \({\chi ^2}\) statistic. Award (R1)(ft) for comparing the appropriate values. The (A1)(ft) can be awarded only if the conclusion is valid according to the comparison given. If no reason given or if reason is wrong the two marks are lost.[8 marks]
(i) \(\frac{{98}}{{200}}( = 0.49{\text{, }}49\% )\) (A1)(A1)(G2)
Note: (A1) for numerator, (A1) for denominator.
(ii) \(\frac{{15}}{{45}}( = 0.333{\text{, }}33.3\% )\) (A1)(A1)(G2)
Note: (A1) for numerator, (A1) for denominator.[4 marks]
(i) \(\frac{{98}}{{200}} \times \frac{{97}}{{199}} = 0.239{\text{ }}(23.9\% )\) (A1)(M1)(A1)(G3)
Note: (A1) for correct probabilities seen, (M1) for multiplying two probabilities, (A1) for correct answer.
(ii) \(1 – \frac{{102}}{{200}} \times \frac{{101}}{{199}} = 0.741{\text{ }}(74.1\% )\) (M1)(M1)(A1)(ft)(G2)
Note: (M1) for showing the product, (M1) for using the probability of the complement, (A1) for correct answer. Follow through for consistent use of with replacement.
OR
\(\frac{{98}}{{200}} \times \frac{{97}}{{199}} + \frac{{98}}{{200}} \times \frac{{102}}{{199}} + \frac{{102}}{{200}} \times \frac{{98}}{{199}} = 0.741{\text{ }}(74.1\% )\) (M1)(M1)(A1)(ft)(G2)
Note: (M1) for adding three products of fractions (or equivalent), (M1) for using the correct fractions, (A1) for correct answer. Follow through for consistent use of with replacement.[6 marks]
Question
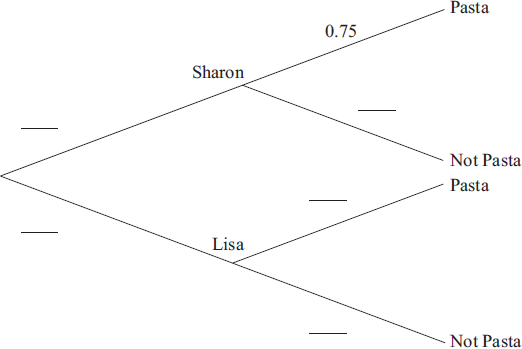
Sharon and Lisa share a flat. Sharon cooks dinner three nights out of ten. If Sharon does not cook dinner, then Lisa does. If Sharon cooks dinner the probability that they have pasta is 0.75. If Lisa cooks dinner the probability that they have pasta is 0.12.
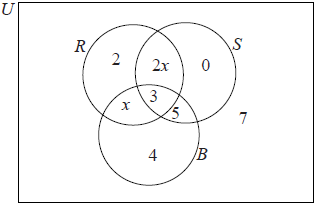
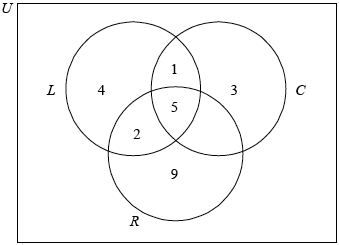
A survey was carried out in a year 12 class. The pupils were asked which pop groups they like out of the Rockers (R), the Salseros (S), and the Bluers (B). The results are shown in the following diagram.
Copy and complete the tree diagram to represent this information.
 [3]
[3]
Find the probability that Lisa cooks dinner and they do not have pasta.[2]
Find the probability that they do not have pasta.[3]
Given that they do not have pasta, find the probability that Lisa cooked dinner.[3]
Write down \(n(R \cap S \cap B)\).[1]
Find \(n(R’)\).[2]
Describe which groups the pupils in the set \(S \cap B\) like.[2]
Use set notation to describe the group of pupils who like the Rockers and the Bluers but do not like the Salseros.[2]
There are 33 pupils in the class.
Find x.[2]
There are 33 pupils in the class.
Find the number of pupils who like the Rockers.[1]
Answer/Explanation
Markscheme
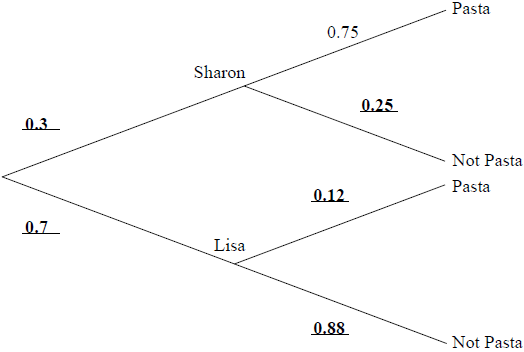
Note: Award (A1) for each correct pair. (A3) [3 marks]
\(0.7 \times 0.88 = 0.616{\text{ }}\left( {\frac{{77}}{{125}},{\text{ }}61.6{\text{ }}\% } \right)\) (M1)(A1)(ft)(G2)
Note: Award (M1) for multiplying the correct probabilities.[2 marks]
\(0.3 \times 0.25 + 0.7 \times 0.88\) (M1)(M1)
Notes: Award (M1) for a relevant two-factor product, could be \(S \times NP\) OR \(L \times NP\).
Award (M1) for summing 2 two-factor products.
\({\text{P}} = 0.691{\text{ }}\left( {\frac{{691}}{{1000}},{\text{ }}69.1{\text{ }}\% } \right)\) (A1)(ft)(G2)
Notes: (ft) from their answer to (b).[3 marks]
\(\frac{{0.616}}{{0.691}}\) (M1)(A1)
Note: Award (M1) for substituted conditional probability formula, (A1) for correct substitution.
\({\text{P}} = 0.891{\text{ }}\left( {\frac{{616}}{{691}},{\text{ }}89.1{\text{ }}\% } \right)\) (A1)(ft)(G2)[3 marks]
3 (A1)[1 mark]
For 5, 4, 7 (0) seen with no extra values (A1)
16 (A1)(G2)[2 marks]
They like (both) the Salseros (S) and they like the Bluers (B) (A1)(A1)
Note: Award (A1) for “and”, (A1) for the correct groups.[2 marks]
\(R \cap B \cap S’\) (A1)(A1)
Note: Award (A1) for \(R \cap B\), (A1) for \( \cap S’\)[2 marks]
\(21+ 3x = 33\) (M1)
\(x = 4\) (A1)(G2)[2 marks]
17 (A1)(ft)[1 mark]
Question
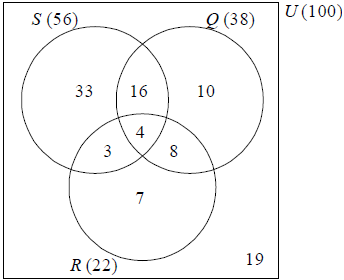
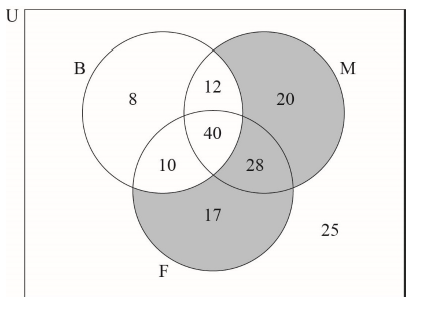
A survey of 100 families was carried out, asking about the pets they own. The results are given below.
56 owned dogs (S)
38 owned cats (Q)
22 owned birds (R)
16 owned dogs and cats, but not birds
8 owned birds and cats, but not dogs
3 owned dogs and birds, but not cats
4 owned all three types of pets
Draw a Venn diagram to represent this information.[5]
Find the number of families who own no pets.[2]
Find the percentage of families that own exactly one pet.[3]
A family is chosen at random. Find the probability that they own a cat, given that they own a bird.[2]
Answer/Explanation
Markscheme
 (A1)(A1)(A1)(A1)(A1)
Note: Award (A1) for rectangle (U not required), (A1) for 3 intersecting circles, (A1) for 4 in central intersection, (A1) for 16, 3, 8 and (A1) for 33, 10, 7 (ft) if subtraction is carried out, or for S(56), Q(38) and R(22) seen by the circles.[5 marks]
100 − 81 (M1)
19 (A1)(ft)(G2)
Note: Award (M1) for subtracting their total from 100.[2 marks]
\(33 +10 + 7\) (M1)
Note: Award (M1) for adding their values from (a).
\(\left( {\frac{{50}}{{100}}} \right) \times 100{\text{ }}\% \) (A1)(ft)
50 % (50) (A1)(ft)(G3)[3 marks]
P (own a cat given they own a bird) \( = \frac{{12}}{{22}}\left( {0.545,\frac{6}{{11}}} \right)\) (A1)(ft)(A1)(ft)
Note: Award (A1)(ft) for the numerator, (A1)(ft) for the denominator.[2 marks]
Question
One day the numbers of customers at three cafés, “Alan’s Diner” ( \(A\) ), “Sarah’s Snackbar” ( \(S\) ) and “Pete’s Eats” ( \(P\) ), were recorded and are given below.
17 were customers of Pete’s Eats only
27 were customers of Sarah’s Snackbar only
15 were customers of Alan’s Diner only
10 were customers of Pete’s Eats and Sarah’s Snackbar but not Alan’s Diner
8 were customers of Pete’s Eats and Alan’s Diner but not Sarah’s Snackbar
Some of the customers in each café were given survey forms to complete to find out if they were satisfied with the standard of service they received.
Draw a Venn Diagram, using sets labelled \(A\) , \(S\) and \(P\) , that shows this information.[3]
There were 48 customers of Pete’s Eats that day. Calculate the number of people who were customers of all three cafés.[2]
There were 50 customers of Sarah’s Snackbar that day. Calculate the total number of people who were customers of Alan’s Diner.[3]
Write down the number of customers of Alan’s Diner that were also customers of Pete’s Eats.[1]
Find \(n[(S \cup P) \cap A’]\).[2]
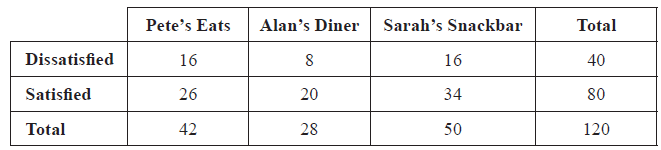
One of the survey forms was chosen at random, find the probability that the form showed “Dissatisfied”;[2]
One of the survey forms was chosen at random, find the probability that the form showed “Satisfied” and was completed at Sarah’s Snackbar;[2]
One of the survey forms was chosen at random, find the probability that the form showed “Dissatisfied”, given that it was completed at Alan’s Diner.[2]
A \({\chi ^2}\) test at the \(5\% \) significance level was carried out to determine whether there was any difference in the level of customer satisfaction in each of the cafés.
Write down the null hypothesis, \({{\text{H}}_0}\) , for the \({\chi ^2}\) test.[1]
A \({\chi ^2}\) test at the \(5\% \) significance level was carried out to determine whether there was any difference in the level of customer satisfaction in each of the cafés.
Write down the number of degrees of freedom for the test.[1]
A \({\chi ^2}\) test at the \(5\% \) significance level was carried out to determine whether there was any difference in the level of customer satisfaction in each of the cafés.
Using your graphic display calculator, find \({\chi ^2}_{calc}\) .[2]
A \({\chi ^2}\) test at the \(5\% \) significance level was carried out to determine whether there was any difference in the level of customer satisfaction in each of the cafés.
State, giving a reason, the conclusion to the test.[2]
Answer/Explanation
Markscheme
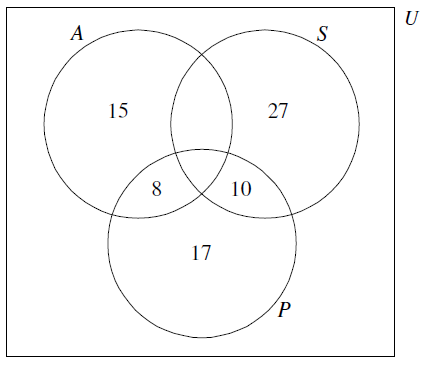
(A1) for rectangle and three labelled intersecting circles
(A1) for \(15\), \(27\) and \(17\)
(A1) for \(10\) and \(8\) (A3)[3 marks]
\(48 – (8 +10 +17)\) or equivalent (M1)
\( = 13\) (A1)(ft)(G2)[2 marks]
\(50 – (27 +10 +13)\) (M1)
Note: Award (M1) for working seen.
\( = 0\) (A1)
number of elements in A \(= 36\) (A1)(ft)(G3)
Note: Follow through from (b).[3 marks]
\(21\) (A1)(ft)
Note: Follow through from (b) even if no working seen.[1 mark]
\(54\) (M1)(A1)(ft)(G2)
Note: Award (M1) for \(17\), \(10\), \(27\) seen. Follow through from (a).[2 marks]
\(\frac{{40}}{{120}}{\text{ }}\left( {\frac{1}{3}{\text{, }}0.333{\text{, }}33.3\% } \right)\) (A1)(A1)(G2)
Note: Award (A1) for numerator, (A1) for denominator.[2 marks]
\(\frac{{34}}{{120}}{\text{ }}\left( {\frac{{17}}{{60}}{\text{, }}0.283{\text{, }}28.3\% } \right)\) (A1)(A1)(G2)
Note: Award (A1) for numerator, (A1) for denominator.[2 marks]
\(\frac{8}{{28}}{\text{ }}\left( {\frac{2}{7}{\text{, }}0.286{\text{, }}28.6\% } \right)\) (A1)(A1)(G2)
Note: Award (A1) for numerator, (A1) for denominator.[2 marks]
customer satisfaction is independent of café (A1)
Note: Accept “customer satisfaction is not associated with the café”.[1 mark]
\(2\) (A1)[1 mark]
\(0.754\) (G2)
Note: Award (G1)(G1)(AP) for \(0.75\) or for correct answer incorrectly rounded to 3 s.f. or more, (G0) for \(0.7\).[2 marks]
since \({\chi ^2}_{calc} < {\chi ^2}_{crit}5.991 accept (or Do not reject) H0 (R1)(A1)(ft)
Note: Follow through from their value in (e).
OR
Accept (or Do not reject) H0 as \(p\)-value \((0.686) > 0.05\) (R1)(A1)(ft)
Notes: Do not award (A1)(R0). Award the (R1) for comparison of appropriate values.[2 marks]
Question
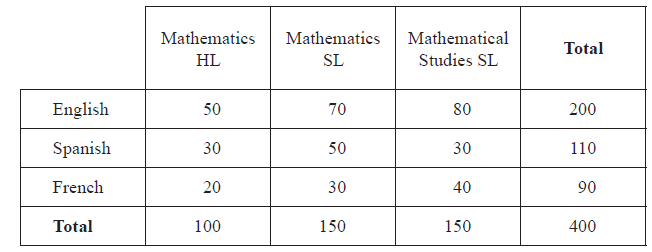
Pam has collected data from a group of 400 IB Diploma students about the Mathematics course they studied and the language in which they were examined (English, Spanish or French). The summary of her data is given below.
A student is chosen at random from the group. Find the probability that the student
(i) studied Mathematics HL;
(ii) was examined in French;
(iii) studied Mathematics HL and was examined in French;
(iv) did not study Mathematics SL and was not examined in English;
(v) studied Mathematical Studies SL given that the student was examined in Spanish.[8]
Pam believes that the Mathematics course a student chooses is independent of the language in which the student is examined.
Using your answers to parts (a) (i), (ii) and (iii) above, state whether there is any evidence for Pam’s belief. Give a reason for your answer.[2]
Pam decides to test her belief using a Chi-squared test at the \(5\% \) level of significance.
(i) State the null hypothesis for this test.
(ii) Show that the expected number of Mathematical Studies SL students who took the examination in Spanish is \(41.3\), correct to 3 significant figures.[3]
Write down
(i) the Chi-squared calculated value;
(ii) the number of degrees of freedom;
(iii) the Chi-squared critical value.[4]
State, giving a reason, whether there is sufficient evidence at the \(5\% \) level of significance that Pam’s belief is correct.[2]
Answer/Explanation
Markscheme
(i) \(\frac{{100}}{{400}}{\text{ }}\left( {\frac{1}{4}{\text{, }}0.25{\text{, }}25\% } \right)\) (A1)
(ii) \(\frac{{90}}{{400}}{\text{ }}\left( {\frac{9}{{40}}{\text{, }}0.225{\text{, }}22.5\% } \right)\) (A1)
(iii) \(\frac{{20}}{{400}}{\text{ }}\left( {\frac{1}{{20}}{\text{, }}0.05{\text{, }}5\% } \right)\) (A1)(A1)
Note: Award (A1) for numerator, (A1) for denominator.
(iv) \(\frac{{120}}{{400}}{\text{ }}\left( {\frac{3}{{10}}{\text{, }}0.3{\text{, }}30\% } \right)\) (A1)(A1)
Note: Award (A1) for numerator, (A1) for denominator.
(v) \(\frac{{30}}{{110}}{\text{ }}\left( {\frac{3}{{11}}{\text{, }}0.273{\text{, }}27.3\% } \right)\) (\(0.272727 \ldots \)) (A1)(A1)
Note: Award (A1) for numerator, (A1) for denominator. Accept \(0.27\), do not accept \(0.272\), do not accept \(0.3\).[8 marks]
\(\frac{1}{{20}} \ne \frac{1}{4} \times \frac{9}{{40}}\) (R1)(ft)
Note: The fractions must be used as part of the reason. Follow through from (a)(i), (a)(ii) and (a)(iii).
Pam is not correct. (A1)(ft)
Notes: Do not award (R0)(A1). Accept the events are not independent (dependent).[2 marks]
(i) The mathematics course and language of examination are independent. (A1)
Notes: Accept “There is no association between Mathematics course and language”. Do not accept “not related”, “not correlated”, “not influenced”.
(ii) \(\frac{{110}}{{400}} \times \frac{{150}}{{400}} \times 400{\text{ }}\left( { = \frac{{110 \times 150}}{{400}}} \right)\) (M1)
\( = 41.25\) (A1)
\( = 41.3\) (AG)
Note: \(41.25\) and \(41.3\) must be seen to award final (A1).[3 marks]
(i) \(7.67\) (\(7.67003 \ldots \)) (G2)
Note: Accept \(7.7\), do not accept \(8\) or \(7.6\). Award (G1) if formula with all nine terms seen but their answer is not one of those above.
(ii) \(4\) (G1)
(iii) \(9.488\) (A1)(ft)
Notes: Accept \(9.49\) or \(9.5\), do not accept \(9.4\) or \(9\). Follow through from their degrees of freedom.[4 marks]
\(7.67 < 9.488\) (R1)
OR
\(p = 0.104 \ldots , p > 0.05\) (R1)
Accept (Do not reject) \({H_0}\) (Pam’s belief is correct) (A1)(ft)
Notes: Follow through from part (d). Do not award (R0)(A1).[2 marks]
Question
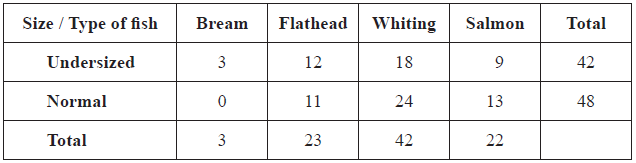
Leanne goes fishing at her favourite pond. The pond contains four different types of fish: bream, flathead, whiting and salmon. The fish are either undersized or normal. This information is shown in the table below.
Write down the total number of fish in the pond.[1]
Leanne catches a fish.
Find the probability that she
(i) catches an undersized bream;
(ii) catches either a flathead or an undersized fish or both;
(iii) does not catch an undersized whiting;
(iv) catches a whiting given that the fish was normal.[7]
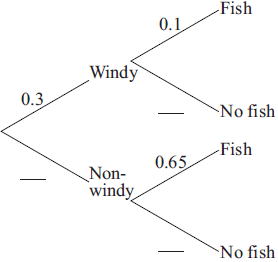
Leanne notices that on windy days, the probability she catches a fish is 0.1 while on non-windy days the probability she catches a fish is 0.65. The probability that it will be windy on a particular day is 0.3.
Copy and complete the probability tree diagram below.
 [3]
[3]
Leanne notices that on windy days, the probability she catches a fish is 0.1 while on non-windy days the probability she catches a fish is 0.65. The probability that it will be windy on a particular day is 0.3.
Calculate the probability that it is windy and Leanne catches a fish on a particular day.[2]
Leanne notices that on windy days, the probability she catches a fish is 0.1 while on non-windy days the probability she catches a fish is 0.65. The probability that it will be windy on a particular day is 0.3.
Calculate the probability that Leanne catches a fish on a particular day.[3]
Use your answer to part (e) to calculate the probability that Leanne catches a fish on two consecutive days.[2]
Leanne notices that on windy days, the probability she catches a fish is 0.1 while on non-windy days the probability she catches a fish is 0.65. The probability that it will be windy on a particular day is 0.3.
Given that Leanne catches a fish on a particular day, calculate the probability that the day was windy.[3]
Answer/Explanation
Markscheme
90 (A1)[1 mark]
(i) \(\frac{3}{{90}}(0.0\bar 3,{\text{ }}0.0333,{\text{ }}0.0333…,{\text{ }}3.\bar 3\% ,{\text{ }}3.33\% )\) (A1)(ft)
Note: For the denominator follow through from their answer in part (a).
(ii) \(\frac{{53}}{{90}}(0.5\bar 8,{\text{ }}0.588…,{\text{ }}0.589,{\text{ }}58.\bar 8\% ,{\text{ }}58.9\% )\) (A1)(A1)(ft)(G2)
Notes: Award (A1) for the numerator. (A1)(ft) for denominator. For the denominator follow through from their answer in part (a).
(iii) \(\frac{{72}}{{90}}{\text{(0.8, 80}}\%)\) (A1)(ft)(A1)(ft)(G2)
Notes: Award (A1)(ft) for the numerator, (their part (a) –18) (A1)(ft) for denominator. For the denominator follow through from their answer in part (a).
(iv) \(\frac{{24}}{{48}}(0.5,{\text{ 50}}\% )\) (A1)(A1)(G2)
Note: Award (A1) for numerator, (A1) for denominator.[7 marks]
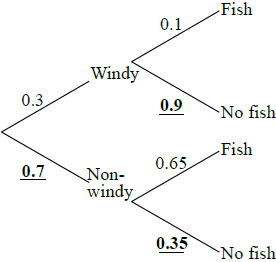 (A1)(A1)(A1)
Notes: Award (A1) for each correct entry. Tree diagram must be seen for marks to be awarded.[3 marks]
\(0.3 \times 0.1 = 0.03\left( {\frac{3}{{100}}} \right)\) (M1)(A1)(G2)
Note: Award (M1) for correct product seen.[2 marks]
\(0.3 \times 0.1+ 0.7\times0.65\) (M1)(M1)
Notes: Award (M1) for \(0.7\times0.65\) (or 0.455) seen, (M1) for adding their 0.03. Follow through from their answers to parts (c) and (d).
\( = 0.485\left( {\frac{{485}}{{1000}},\frac{{97}}{{200}}} \right)\) (A1)(ft)(G2)
Note: Follow through from their tree diagram and their answer to part (d).[3 marks]
\(0.485 \times 0.485\) (M1)
\(0.235\left( {\frac{{9409}}{{40000}}{\text{, }}0.235225} \right)\) (A1)(ft)(G2)
Note: Follow through from their answer to part (e).[2 marks]
\(\frac{{0.03}}{{0.485}}\) (M1)(A1)(ft)
Notes: Award (M1) for substituted conditional probability formula, (A1)(ft) for their (d) as numerator and their (e) as denominator.
\(0.0619\left( {\frac{{6}}{{97}}}\text{, 0.0618556…} \right) \) (A1)(ft)(G2)
Note: Follow through from their parts (d) and (e).[3 marks]
Question
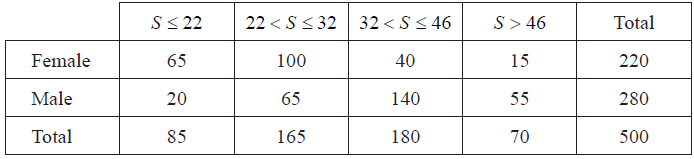
A store recorded their sales of televisions during the 2010 football World Cup. They looked at the numbers of televisions bought by gender and the size of the television screens.
This information is shown in the table below; S represents the size of the television screen in inches.
The store wants to use this information to predict the probability of selling these sizes of televisions for the 2014 football World Cup.
Use the table to find the probability that
(i) a television will be bought by a female;
(ii) a television with a screen size of 32 < S ≤ 46 will be bought;
(iii) a television with a screen size of 32 < S ≤ 46 will be bought by a female;
(iv) a television with a screen size greater than 46 inches will be bought, given that it is bought by a male.[6]
The manager of the store wants to determine whether the screen size is independent of gender. A Chi-squared test is performed at the 1 % significance level.
Write down the null hypothesis.[1]
The manager of the store wants to determine whether the screen size is independent of gender. A Chi-squared test is performed at the 1 % significance level.
Show that the expected frequency for females who bought a screen size of 32 < S ≤ 46, is 79, correct to the nearest integer.[2]
The manager of the store wants to determine whether the screen size is independent of gender. A Chi-squared test is performed at the 1 % significance level.
Write down the number of degrees of freedom.[1]
The manager of the store wants to determine whether the screen size is independent of gender. A Chi-squared test is performed at the 1 % significance level.
Write down the \({\chi ^2}\) calculated value.[2]
The manager of the store wants to determine whether the screen size is independent of gender. A Chi-squared test is performed at the 1 % significance level.
Write down the critical value for this test.[1]
The manager of the store wants to determine whether the screen size is independent of gender. A Chi-squared test is performed at the 1 % significance level.
Determine if the null hypothesis should be accepted. Give a reason for your answer.[2]
Answer/Explanation
Markscheme
(i) \(\frac{{220}}{{500}}\left( {\frac{{11}}{{25}},{\text{ 0}}{\text{.44, 44}}\% } \right)\) (A1)(G1)
(ii) \(\frac{{180}}{{500}}\left( {\frac{{9}}{{25}},{\text{ 0}}{\text{.36, 36}}\% } \right)\) (A1)(G1)
(iii) \(\frac{{40}}{{500}}\left( {\frac{{2}}{{25}},{\text{ 0}}{\text{.08, 8}}\% } \right)\) (A1)(A1)(G2)
(iv) \(\frac{{55}}{{500}}\left( {\frac{{11}}{{56}},{\text{ 0}}{\text{.196, 19.6}}\% } \right)\) (A1)(A1)(G2)
Note: Award (A1) for numerator, (A1) for denominator. Award (A0)(A0) if answers are given as incorrect reduced fractions without working.[6 marks]
“The size of the television screen is independent of gender.” (A1)
Note: Accept “not associated”, do not accept “not correlated”.[1 mark]
\(\frac{{180}}{{500}} \times \frac{{220}}{{500}} \times 500\) OR \(\frac{{180 \times 220}}{{500}}\) (M1)
= 79.2 (A1)
= 79 (AG)
Note: Both the unrounded and the given answer must be seen for the final (A1) to be awarded.[2 marks]
3 (A1)[1 mark]
\(\chi _{calc}^2\) = 104(103.957…) (G2)
Note: Award (M1) if an attempt at using the formula is seen but incorrect answer obtained.
[2 marks]
11.345 (A1)(ft)
Notes: Follow through from their degrees of freedom.[1 mark]
\(\chi _{calc}^2\) > \(\chi _{crit}^2\) OR p < 0.01 (R1)
Do not accept H0. (A1)(ft)
Note: Do not award (R0)(A1)(ft). Follow through from their parts (d), (e) and (f).[2 marks]
Question
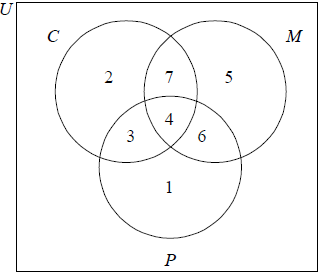
Forty families were surveyed about the places they went to on the weekend. The places were the circus (C), the museum (M) and the park (P).
16 families went to the circus
22 families went to the museum
14 families went to the park
4 families went to all three places
7 families went to both the circus and the museum, but not the park
3 families went to both the circus and the park, but not the museum
1 family went to the park only
Draw a Venn diagram to represent the given information using sets labelled C, M and P. Complete the diagram to include the number of families represented in each region.[4]
Find the number of families who
(i) went to the circus only;
(ii) went to the museum and the park but not the circus;
(iii) did not go to any of the three places on the weekend.[4]
A family is chosen at random from the group of 40 families. Find the probability that the family went to
(i) the circus;
(ii) two or more places;
(iii) the park or the circus, but not the museum;
(iv) the museum, given that they also went to the circus.[8]
Two families are chosen at random from the group of 40 families.
Find the probability that both families went to the circus.[3]
Answer/Explanation
Markscheme
 (A1)(A1)(A1)(A1)
Award (A1) for 3 intersecting circles and rectangle, (A1) for 1, 3, 4 and 7, (A1) for 2, (A1) for 6 and 5.
(i) 2 (A1)(ft)
(ii) 6 (A1)(ft)
(iii) 40 − (1 + 6 + 2 + 3 + 4 + 7 + 5) (M1)
Note: Award (M1) for subtracting all their values from 40.
= 12 (A1)(ft)(G2)
Note: Follow through from their Venn diagram for parts (i), (ii) and (iii).
(i) \(\frac{{16}}{{40}}\left( {\frac{2}{5},0.4,40\% } \right)\) (A1)(A1)(G2)
Note: Award (A1) for numerator, (A1) for denominator. Answer must be less than 1 otherwise award (A0)(A0). Award (A0)(A0) if answer is given as incorrect reduced fraction without working.
(ii) \(\frac{{20}}{{40}}\left( {\frac{1}{2},0.5,50\% } \right)\) (A1)(ft) (A1) (G2)
Note: Award (A1)(ft) for numerator, (A1) for denominator. Follow through from their Venn diagram. Answer must be less than 1 otherwise award (A0)(A0). Award (A0)(A0) if answer is given as incorrect reduced fraction without working.
(iii) \(\frac{6}{{40}}\left( {\frac{3}{{20}},0.15,15\% } \right)\) (A1)(ft)(A1)(G2)
Note: Award (A1)(ft) for numerator, (A1) for denominator. Follow through from their Venn diagram. Answer must be less than 1 otherwise award (A0)(A0). Award (A0)(A0) if answer is given as incorrect reduced fraction without working.
(iv) \(\frac{{11}}{{16}}\left( {0.6875,68.75\% } \right)\) (A1)(ft)(A1)(G2)
Note: Award (A1)(ft) for numerator, (A1) for denominator. Follow through from their Venn diagram. Answer must be less than 1 otherwise award (A0)(A0). Award (A0)(A0) if answer is given as incorrect reduced fraction without working.
\(\frac{{16}}{{40}} \times \frac{{15}}{{39}}\) (A1)(A1)(ft)
Note: Award (A1) for multiplication of their probabilities, (A1)(ft) for their correct probabilities.
\(\frac{{240}}{{1560}}\left( {\frac{2}{{13}},0.153846…,15.4\% } \right)\) (A1)(ft)(G2)
Note: Follow through from their answer to part (c)(i). Answer must be less than 1 otherwise award at most (A1)(A1)(A0)(ft).
Question
A group of tourists went on safari to a game reserve. The game warden wanted to know how many of the tourists saw Leopard (\(L\)), Cheetah (\(C\)) or Rhino (\(R\)). The results are given as follows.
5 of the tourists saw all three
7 saw Leopard and Rhino
1 saw Cheetah and Leopard but not Rhino
4 saw Leopard only
3 saw Cheetah only
9 saw Rhino only
Draw a Venn diagram to show this information.[4]
There were 25 tourists in the group and every tourist saw at least one of the three types of animal.
Find the number of tourists that saw Cheetah and Rhino but not Leopard.[2]
There were 25 tourists in the group and every tourist saw at least one of the three types of animal.
Calculate the probability that a tourist chosen at random from the group
(i) saw Leopard;
(ii) saw only one of the three types of animal;
(iii) saw only Leopard, given that he saw only one of the three types of animal.[6]
There were 25 tourists in the group and every tourist saw at least one of the three types of animal.
If a tourist chosen at random from the group saw Leopard, find the probability that he also saw Cheetah.[2]
Answer/Explanation
Markscheme
 (A1)(A1)(A1)(A1)
Note: Award (A1) for rectangle and three labelled intersecting circles (the rectangle need not be labelled), (A1) for 5, (A1) for 2 and 1, (A1) for 4, 3 and 9.[4 marks]
\(25 – (5 + 2 + 1 + 4 + 3 + 9)\) (M1)
Notes: Award (M1) for their \(5 + 2 + 1 + 4 + 3 + 9\) seen even if total is greater than \(25\).
Do not award (A1)(ft) if their total is greater than \(25\).
\( = 1\) (A1)(ft)(G2)[2 marks]
(i) \(\frac{{12}}{{25}}{\text{ }}(0.48,{\text{ }}48\% )\) (A1)(ft)(A1)(G2)
Notes: Award (A1)(ft) for numerator, (A1) for denominator.
Follow through from Venn diagram.
(ii) \(\frac{{16}}{{25}}{\text{ }}(0.64,{\text{ }}64\% )\) (A1)(A1)(G2)
Notes: Award (A1) for numerator, (A1) for denominator.
There is no follow through; all information is given.
(iii) \(\frac{4}{{16}}{\text{ }}(0.25,{\text{ }}25\% )\)) (A1)(A1)(ft)(G2)
Notes: Award (A1) for numerator, (A1)(ft) for denominator.
Follow through from part (c)(ii) only.[6 marks]
\(\frac{6}{{12}}{\text{ }}(0.5,{\text{ }}50\% )\) (A1)(A1)(ft)(G2)
Notes: Award (A1) for numerator, (A1)(ft) for denominator.
Follow through from Venn diagram.[2 marks]
Question
Tomek is attending a conference in Singapore. He has both trousers and shorts to wear. He also has the choice of wearing a tie or not.
The probability Tomek wears trousers is \(0.3\). If he wears trousers, the probability that he wears a tie is \(0.8\).
If Tomek wears shorts, the probability that he wears a tie is \(0.15\).
The following tree diagram shows the probabilities for Tomek’s clothing options at the conference.
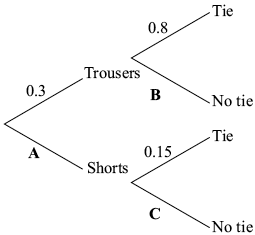
Find the value of
(i) \({\text{A}}\);
(ii) \({\text{B}}\);
(iii) \({\text{C}}\).[3]
Calculate the probability that Tomek wears
(i) shorts and no tie;
(ii) no tie;
(iii) shorts given that he is not wearing a tie.[8]
The conference lasts for two days.
Calculate the probability that Tomek wears trousers on both days.[2]
The conference lasts for two days.
Calculate the probability that Tomek wears trousers on one of the days, and shorts on the other day.[3]
Answer/Explanation
Markscheme
(i) \(0.7 \left( {\frac{{70}}{{100}},{\text{ }}\frac{7}{{10}},{\text{ 70% }}} \right)\) (A1)
(ii) \(0.2 \left( {\frac{{20}}{{100}},{\text{ }}\frac{2}{{10}},{\text{ }}\frac{1}{5},{\text{ 20% }}} \right)\) (A1)
(iii) \(0.85 \left( {\frac{{85}}{{100}},{\text{ }}\frac{{17}}{{20}},{\text{ 85% }}} \right)\) (A1)[3 marks]
(i) \(0.7 \times 0.85\) (M1)
Note: Award (M1) for multiplying their values from parts (a)(i) and (a)(iii).
\( = 0.595{\text{ }}\left( {\frac{{119}}{{200}},{\text{ 59.5% }}} \right)\) (A1)(ft)(G1)
Note: Follow through from part (a).
(ii) \(0.3 \times 0.2 + 0.7 \times 0.85\) (M1)(M1)
Note: Award (M1) for their two products, (M1) for adding their two products.
\( = 0.655{\text{ }}\left( {\frac{{131}}{{200}},{\text{ 65.5% }}} \right)\) (A1)(ft)(G2)
Note: Follow through from part (a).
(iii) \(\frac{{0.595}}{{0.655}}\) (A1)(ft)(A1)(ft)
Notes: Award (A1)(ft) for correct numerator, (A1)(ft) for correct denominator. Follow through from parts (b)(i) and (ii).
\( = 0.908{\text{ }}\left( {{\text{0.90839}} \ldots ,{\text{ }}\frac{{119}}{{131}},{\text{ 90,8% }}} \right)\) (A1)(ft)(G2)[8 marks]
\(0.3 \times 0.3\) (M1)
\( = 0.09 \left( {\frac{9}{{100}}, 9\%} \right)\) (A1)(G2)[2 marks]
\(0.3 \times 0.7\) (M1)
\(0.3 \times 0.7 \times 2\) OR \((0.3 \times 0.7) + (0.7 \times 0.3)\) (M1)
Note: Award (M1) for their correct product seen, (M1) for multiplying their product by 2 or for adding their products twice.
\( = 0.42 \left( {\frac{{42}}{{100}}, \frac{{21}}{{50}}, 42\%} \right)\) (A1)(ft)(G2)
Note: Follow through from part (a)(i).[3 marks]
Question
Mike, the laboratory mouse, is placed at the starting point, S, of a maze. Some paths in the maze lead to Trap A, some to Trap B, and others to escape doors. Some paths have one and some have two sections. If his path forks, Mike randomly chooses a path forward.
The following tree diagram represents the maze, showing all possible paths, and the probability that Mike chooses a certain section of a path through the maze.
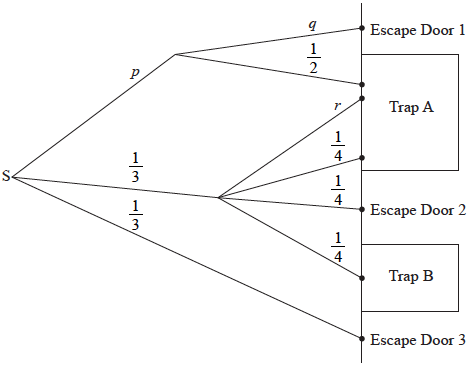
Write down the value of
(i) \(p\) ;
(ii) \(q\) ;
(iii) \(r\).[3]
(i) Find the probability that Mike reaches Trap B.
(ii) Find the probability that Mike reaches Trap A.
(iii) Find the probability that Mike escapes from the maze.[7]
Sonya, a lab assistant, counts the number of paths that lead to traps or escape doors. She believes that the probability that Mike will be trapped is greater than the probability that he will escape.
State whether Sonya is correct. Give a mathematical justification for your conclusion.[2]
During the first trial Mike escapes.
Given that Mike escaped, find the probability that he went directly from S to Escape Door 3.[3]
Answer/Explanation
Markscheme
(i) \(\frac{1}{3}\;\;\;(0.333333…,{\text{ }}33.3333…\% )\) (A1)
(ii) \(\frac{1}{2}\;\;\;(0.5,{\text{ }}50\% )\) (A1)
(iii) \(\frac{1}{4}\;\;\;(0.25,{\text{ }}25\% )\) (A1)
(i) \(\frac{1}{3} \times \frac{1}{4}\) (M1)
\( = \frac{1}{{12}}\;\;\;({\text{0.0833333…, 8.33333…% )}}\) (A1)(G2)
(ii) \(\frac{1}{3} \times \frac{1}{2} + \frac{1}{3} \times \frac{1}{4} + \frac{1}{3} \times \frac{1}{4}\) (A1)(ft)(M1)
Note: Award (A1)(ft) for their three correct products seen, (M1) for addition of their products.
\( = \frac{1}{3}\;\;\;(0.333333…,{\text{ }}33.3333…\% )\) (A1)(ft)(G2)
Note: Follow through from their parts (a)(i) and (a)(iii).
(iii) \(1 – \frac{1}{{12}} – \frac{1}{3}\) (M1)
Note: Follow through from parts (b)(i) and (b)(ii).
OR
\(\frac{1}{3} \times \frac{1}{2} + \frac{1}{3} \times \frac{1}{4} + \frac{1}{3}\) (M1)
Note: Follow through from parts (a)(i) and (a)(ii).
\( = \frac{7}{{12}}\;\;\;(0.583333…,{\text{ }}58.3333…\% )\) (A1)(ft)(G2)
Sonya is not correct. (A1)(ft)
The probability that Mike escapes is \(\frac{7}{{12}}\), which is
greater than \(\frac{5}{{12}}{\text{ }}\left( {{\text{or greater than }}\frac{1}{2}} \right)\). (R1)(ft)
Notes: Do not award (A1)(R0).
Follow through from their answers to part (b).
\(\frac{{\frac{1}{3}}}{{\frac{7}{{12}}}}\) (A1)(A1)(ft)
Note: Award (A1) for correct numerator, (A1) for correct denominator.
\( = \frac{4}{7}\;\;\;\left( {\frac{{12}}{{21}},{\text{ 0.571428…, 57.1428…% }}} \right)\) (A1)(ft)(G2)
Note: Follow through from their answer to part (b)(iii).
Question
A group of students at Dune Canyon High School were surveyed. They were asked which of the following products: books (B), music (M) or films (F), they downloaded from the internet.
The following results were obtained:
100 students downloaded music;
95 students downloaded films;
68 students downloaded films and music;
52 students downloaded books and music;
50 students downloaded films and books;
40 students downloaded all three products;
8 students downloaded books only;
25 students downloaded none of the three products.
Use the above information to complete a Venn diagram.[5]
Calculate the number of students who were surveyed.[2]
i) On your Venn diagram, shade the set \({\left( {F \cup M} \right) \cap B’}\) . Do not shade any labels or values on the diagram.
ii) Find \(n\left( {\left( {F \cup M} \right) \cap B’} \right)\) .[3]
A student who was surveyed is chosen at random.
Find the probability that
(i) the student downloaded music;
(ii) the student downloaded books, given that they had not downloaded films;
(iii) the student downloaded at least two of the products.[6]
Dune Canyon High School has 850 students.
Find the expected number of students at Dune Canyon High School that downloaded music.[2]
Answer/Explanation
Markscheme
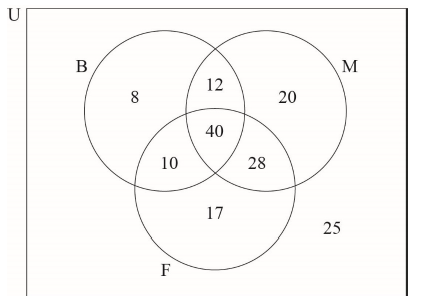
(A1)(A1)(A1)(A1)(A1)
Note: Award (A1) for labelled sets B, M and F inside a universal set (label U is not required).
Award (A1) for \({\text{40}}\) in central area.
Award (A1) for correct \({\text{10, 12, 28}}\) in the other intersecting regions.
Award (A1) for \({\text{8, 20}}\) and \({\text{17}}\) in correct regions.
Award (A1) for correct \({\text{25}}\).
\(8 + 12 + 20 + 10 + 40 + 28 + 17 + 25\) (M1)
\( = 160\) (A1)(ft)(G2)
Note: Award (M1) for adding all values. Follow through from their Venn Diagram.
i)
(A1)
ii) \(20 + 28 + 17\) (M1)
OR
\((100 + 95 – 68) – (10 + 40 + 12)\) (M1)
\( = 65\) (A1)(ft)(G2)
Note: Award (M1) for addition of the correct values from their diagram. Follow through from part (a) or (b) and part (c)(i).
i) \(\frac{{100}}{{160}}\,\,\left( {\frac{5}{8},\,\,0.625,\,\,62.5\% } \right)\) (A1)(A1)(ft)
Note: Award (A1) for correct numerator, (A1)(ft) for correct denominator. Follow through from part (b).
ii) \(\frac{{20}}{{65}}\,\,\left( {\frac{4}{{13}},\,\,0.308,\,\,30.8\% } \right)\,\,\,(0.307692…)\) (A1)(ft)(A1)(ft)
Note: Award (A1)(ft) for correct numerator, (A1)(ft) for correct denominator. Follow through from part (a).
iii) \(\frac{{90}}{{160}}\,\,\left( {\frac{9}{{16}},\,\,0.563,\,\,56.3\% } \right)\,\,\,(0.5625)\) (A1)(ft)(A1)(ft)
Note: Award (A1)(ft) for correct numerator, (A1)(ft) for correct denominator. Follow through from parts (a) and (b).
\(\frac{{100}}{{160}} \times 850\) (M1)
Note: Award (M1) for their part (d)(i) multiplied by \(850\).
\( = 531\,\,\,(531.25)\) (A1)(ft)(G2)
Note: Follow through from part (d)(i) or from part (b).
Question
\(180\) people were interviewed and asked what types of transport they had used in the last year from a choice of airplane \((A)\), train \((T)\) or bus \((B)\). The following information was obtained.
\(47\) had travelled by airplane
\(68\) had travelled by train
\(122\) had travelled by bus
\(25\) had travelled by airplane and train
\(32\) had travelled by airplane and bus
\(35\) had travelled by train and bus
\(20\) had travelled by all three types of transport
Draw a Venn diagram to show the above information.[4]
Find the number of people who, in the last year, had travelled by
(i) bus only;
(ii) both airplane and bus but not by train;
(iii) at least two types of transport;
(iv) none of the three types of transport.[6]
A person is selected at random from those who were interviewed.
Find the probability that the person had used only one type of transport in the last year.[2]
Given that the person had used only one type of transport in the last year, find the probability that the person had travelled by airplane.[2]
Answer/Explanation
Markscheme
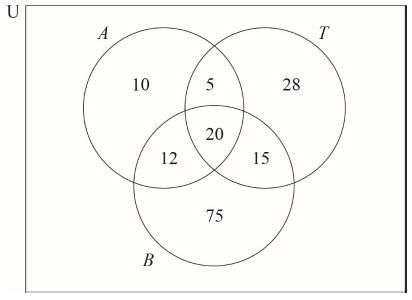
(A1)(A1)(A1)(A1)
Note: Award (A1) for a rectangle with \(3\) intersecting clearly labelled circles.
Award (A1) for \(20\) in correct region.
Award (A1) for \(15\), \(12\), \(5\) in correct regions.
Award (A1) for \(75\), \(28\), \(10\) in correct regions.
(i) \(75\) (A1)(ft)
Note: Follow through from their Venn diagram.
(ii) \(12\) (A1)(ft)
Note: Follow through from their Venn diagram.
(iii) \(15 + 20 + 12 + 5\) (M1)
\( = 52\) (A1)(ft)(G2)
Note: Award (M1) for addition of their \(15\), \(20\), \(12\) and \(5\). Follow through from their Venn diagram.
(iv) \(180 – 165\) (M1)
Note: Award BI for their \(165\), or a sum adding to their \(165\), seen.
\(15\) (A1)(ft)(G2)
Note: Follow through from their Venn diagram.
\(\frac{{113}}{{180}}\,\,\,(0.628,\,\,62.8\,\% ,\,\,0.62777…)\) (A1)(ft)(A1)(G2)
Note: Award (A1)(ft) for correct numerator. Follow through from their Venn diagram.
Award (A1) for \(180\) in the denominator.
\(\frac{{10}}{{113}}\,\,\,(0.0885,\,\,8.85\,\% ,\,\,0.08849…)\) (A1)(ft)(A1)(ft)(G2)
Note: Award (A1)(ft) for correct numerator, (A1)(ft) for correct denominator. Follow through from their Venn diagram or numerator from part (c).
Question
A group of 66 people went on holiday to Hawaii. During their stay, three trips were arranged: a boat trip (\(B\)), a coach trip (\(C\)) and a helicopter trip (\(H\)).
From this group of people:
| 3 | went on all three trips; |
| 16 | went on the coach trip only; |
| 13 | went on the boat trip only; |
| 5 | went on the helicopter trip only; |
| x | went on the coach trip and the helicopter trip but not the boat trip; |
| 2x | went on the boat trip and the helicopter trip but not the coach trip; |
| 4x | went on the boat trip and the coach trip but not the helicopter trip; |
| 8 | did not go on any of the trips. |
One person in the group is selected at random.
Draw a Venn diagram to represent the given information, using sets labelled \(B\), \(C\) and \(H\).[5]
Show that \(x = 3\).[2]
Write down the value of \(n(B \cap C)\).[1]
Find the probability that this person
(i) went on at most one trip;
(ii) went on the coach trip, given that this person also went on both the helicopter trip and the boat trip.[4]
Answer/Explanation
Markscheme
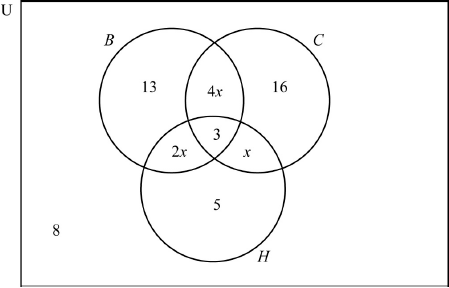 (A5)
(A5)
Notes: Award (A1) for rectangle and three labelled intersecting circles (U need not be seen),
(A1) for 3 in the correct region,
(A1) for 8 in the correct region,
(A1) for 5, 13 and 16 in the correct regions,
(A1) for \(x\), \(2x\) and \(4x\) in the correct regions.[5 marks]
\(8 + 13 + 16 + 3 + 5 + x + 2x + 4x = 66\) (M1)
Note: Award (M1) for either a completely correct equation or adding all the terms from their diagram in part (a) and equating to 66.
Award (M0)(A0) if their equation has no \(x\).
\(7x = 66 – 45\) OR \(7x + 45 = 66\) (A1)
Note: Award (A1) for adding their like terms correctly, but only when the solution to their equation is equal to 3 and is consistent with their original equation.
\(x = 3\) (AG)
Note: The conclusion \(x = 3\) must be seen for the (A1) to be awarded.[2 marks]
15 (A1)(ft)
Note: Follow through from part (a). The answer must be an integer.[1 mark]
(i) \(\frac{{42}}{{66}}{\text{ }}\left( {\frac{7}{{11}},{\text{ }}0.636,{\text{ }}63.6\% } \right)\) (A1)(ft)(A1)(G2)
Note: Award (A1)(ft) for numerator, (A1) for denominator. Follow through from their Venn diagram.
(ii) \(\frac{3}{9}{\text{ }}\left( {\frac{1}{3},{\text{ }}0.333,{\text{ }}33.3\% } \right)\) (A1)(A1)(ft)(G2)
Note: Award (A1) for numerator, (A1)(ft) for denominator. Follow through from their Venn diagram.[4 marks]
Question
A company performs an experiment on the efficiency of a liquid that is used to detect a nut allergy.
A group of 60 people took part in the experiment. In this group 26 are allergic to nuts. One person from the group is chosen at random.
A second person is chosen from the group.
When the liquid is added to a person’s blood sample, it is expected to turn blue if the person is allergic to nuts and to turn red if the person is not allergic to nuts.
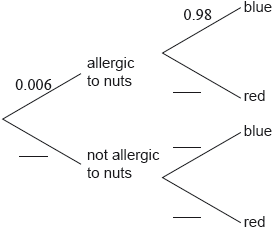
The company claims that the probability that the test result is correct is 98% for people who are allergic to nuts and 95% for people who are not allergic to nuts.
It is known that 6 in every 1000 adults are allergic to nuts.
This information can be represented in a tree diagram.
An adult, who was not part of the original group of 60, is chosen at random and tested using this liquid.
The liquid is used in an office to identify employees who might be allergic to nuts. The liquid turned blue for 38 employees.
Find the probability that this person is not allergic to nuts.[2]
Find the probability that both people chosen are not allergic to nuts.[2]
Copy and complete the tree diagram.[3]
Find the probability that this adult is allergic to nuts and the liquid turns blue.[2]
Find the probability that the liquid turns blue.[3]
Find the probability that the tested adult is allergic to nuts given that the liquid turned blue.[3]
Estimate the number of employees, from this 38, who are allergic to nuts.[2]
Answer/Explanation
Markscheme
\(\frac{{34}}{{60}}{\text{ }}\left( {\frac{{17}}{{30}},{\text{ }}0.567,{\text{ }}0.566666 \ldots ,{\text{ }}56.7\% } \right)\) (A1)(A1)
Note: Award (A1) for correct numerator, (A1) for correct denominator.[2 marks]
\(\frac{{34}}{{60}} \times \frac{{33}}{{59}}\) (M1)
Note: Award (M1) for their correct product.
\( = 0.317{\text{ }}\left( {\frac{{187}}{{590}},{\text{ }}0.316949 \ldots ,{\text{ }}31.7\% } \right)\) (A1)(ft)(G2)
Note: Follow through from part (a).[ marks]
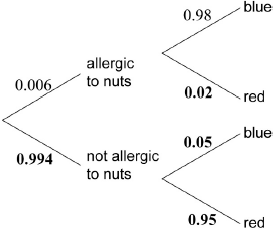 (A1)(A1)(A1)
Note: Award (A1) for each correct pair of branches.[3 marks]
\(0.006 \times 0.98\) (M1)
Note: Award (M1) for multiplying 0.006 by 0.98.
\( = 0.00588{\text{ }}\left( {\frac{{147}}{{25000}},{\text{ }}0.588\% } \right)\) (A1)(G2)[2 marks]
\(0.006 \times 0.98 + 0.994 \times 0.05{\text{ }}(0.00588 + 0.994 \times 0.05)\) (A1)(ft)(M1)
Note: Award (A1)(ft) for their two correct products, (M1) for adding two products.
\( = 0.0556{\text{ }}\left( {0.05558,{\text{ }}5.56\% ,{\text{ }}\frac{{2779}}{{50000}}} \right)\) (A1)(ft)(G3)
Note: Follow through from parts (c) and (d).[3 marks]
\(\frac{{0.006 \times 0.98}}{{0.05558}}\) (M1)(M1)
Note: Award (M1) for their correct numerator, (M1) for their correct denominator.
\( = 0.106{\text{ }}\left( {0.105793 \ldots ,{\text{ }}10.6\% ,{\text{ }}\frac{{42}}{{397}}} \right)\) (A1)(ft)(G3)
Note: Follow through from parts (d) and (e).[3 marks]
\(0.105793 \ldots \times 38\) (M1)
Note: Award (M1) for multiplying 38 by their answer to part (f).
\( = 4.02{\text{ }}(4.02015 \ldots )\) (A1)(ft)(G2)
Notes: Follow through from part (f). Use of 3 sf result from part (f) results in an answer of 4.03 (4.028).[2 marks]
Question
On one day 180 flights arrived at a particular airport. The distance travelled and the arrival status for each incoming flight was recorded. The flight was then classified as on time, slightly delayed, or heavily delayed.
The results are shown in the following table.
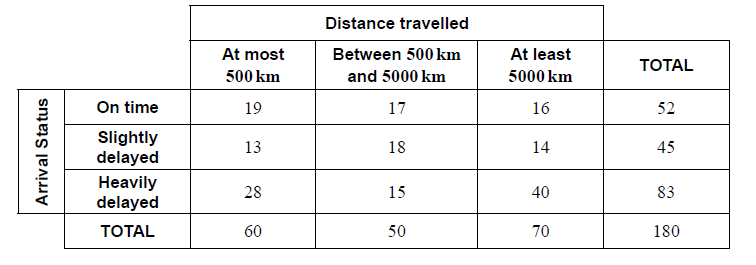
A χ2 test is carried out at the 10 % significance level to determine whether the arrival status of incoming flights is independent of the distance travelled.
The critical value for this test is 7.779.
A flight is chosen at random from the 180 recorded flights.
State the alternative hypothesis.[1]
Calculate the expected frequency of flights travelling at most 500 km and arriving slightly delayed.[2]
Write down the number of degrees of freedom.[1]
Write down the χ2 statistic.[2]
Write down the associated p-value.[1]
State, with a reason, whether you would reject the null hypothesis.[2]
Write down the probability that this flight arrived on time.[2]
Given that this flight was not heavily delayed, find the probability that it travelled between 500 km and 5000 km.[2]
Two flights are chosen at random from those which were slightly delayed.
Find the probability that each of these flights travelled at least 5000 km.[3]
Answer/Explanation
Markscheme
The arrival status is dependent on the distance travelled by the incoming flight (A1)
Note: Accept “associated” or “not independent”.[1 mark]
\(\frac{{60 \times 45}}{{180}}\) OR \(\frac{{60}}{{180}} \times \frac{{45}}{{180}} \times 180\) (M1)
Note: Award (M1) for correct substitution into expected value formula.
= 15 (A1) (G2)[2 marks]
4 (A1)
Note: Award (A0) if “2 + 2 = 4” is seen.[1 mark]
9.55 (9.54671…) (G2)
Note: Award (G1) for an answer of 9.54.[2 marks]
0.0488 (0.0487961…) (G1)[1 mark]
Reject the Null Hypothesis (A1)(ft)
Note: Follow through from their hypothesis in part (a).
9.55 (9.54671…) > 7.779 (R1)(ft)
OR
0.0488 (0.0487961…) < 0.1 (R1)(ft)
Note: Do not award (A1)(ft)(R0)(ft). Follow through from part (d). Award (R1)(ft) for a correct comparison, (A1)(ft) for a consistent conclusion with the answers to parts (a) and (d). Award (R1)(ft) for χ2calc > χ2crit , provided the calculated value is explicitly seen in part (d)(i).[2 marks]
\(\frac{{52}}{{180}}\,\,\left( {0.289,\,\,\frac{{13}}{{45}},\,\,28.9\,{\text{% }}} \right)\) (A1)(A1) (G2)
Note: Award (A1) for correct numerator, (A1) for correct denominator.[2 marks]
\(\frac{{35}}{{97}}\,\,\left( {0.361,\,\,36.1\,{\text{% }}} \right)\) (A1)(A1) (G2)
Note: Award (A1) for correct numerator, (A1) for correct denominator.[2 marks]
\(\frac{{14}}{{45}} \times \frac{{13}}{{44}}\) (A1)(M1)
Note: Award (A1) for two correct fractions and (M1) for multiplying their two fractions.
\( = \frac{{182}}{{1980}}\,\,\left( {0.0919,\,\,\frac{{91}}{{990}},\,0.091919 \ldots ,\,9.19\,{\text{% }}} \right)\) (A1) (G2)[3 marks]
Question
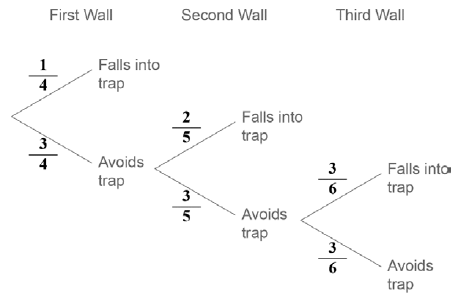
Contestants in a TV gameshow try to get through three walls by passing through doors without falling into a trap. Contestants choose doors at random.
If they avoid a trap they progress to the next wall.
If a contestant falls into a trap they exit the game before the next contestant plays.
Contestants are not allowed to watch each other attempt the game.
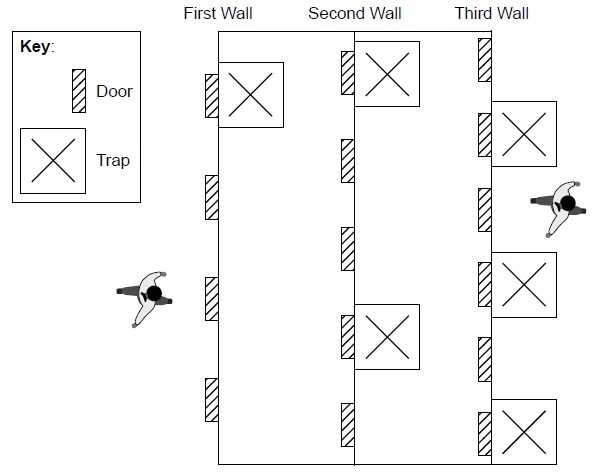
The first wall has four doors with a trap behind one door.
Ayako is a contestant.
Natsuko is the second contestant.
The second wall has five doors with a trap behind two of the doors.
The third wall has six doors with a trap behind three of the doors.
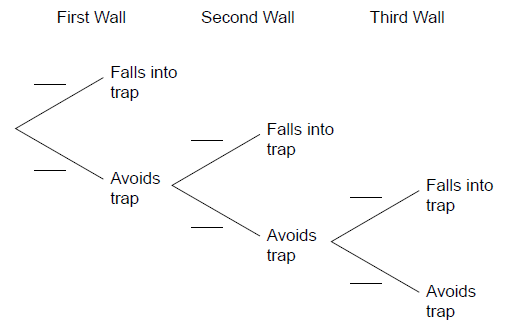
The following diagram shows the branches of a probability tree diagram for a contestant in the game.
Write down the probability that Ayako avoids the trap in this wall.[1]
Find the probability that only one of Ayako and Natsuko falls into a trap while attempting to pass through a door in the first wall.[3]
Copy the probability tree diagram and write down the relevant probabilities along the branches.[3]
A contestant is chosen at random. Find the probability that this contestant fell into a trap while attempting to pass through a door in the second wall.[2]
A contestant is chosen at random. Find the probability that this contestant fell into a trap.[3]
120 contestants attempted this game.
Find the expected number of contestants who fell into a trap while attempting to pass through a door in the third wall.[3]
Answer/Explanation
Markscheme
\(\frac{3}{4}\) (0.75, 75%) (A1)[1 mark]
\(\frac{3}{4} \times \frac{1}{4} + \frac{1}{4} \times \frac{3}{4}\) OR \(2 \times \frac{3}{4} \times \frac{1}{4}\) (M1)(M1)
Note: Award (M1) for their product \(\frac{1}{4} \times \frac{3}{4}\) seen, and (M1) for adding their two products or multiplying their product by 2.
\( = \frac{3}{8}\,\,\,\,\left( {\frac{6}{{16}},\,\,0.375,\,\,37.5{\text{% }}} \right)\) (A1)(ft) (G3)
Note: Follow through from part (a), but only if the sum of their two fractions is 1.[3 marks]
 (A1)(ft)(A1)(A1)
Note: Award (A1) for each correct pair of branches. Follow through from part (a).[3 marks]
\(\frac{3}{4} \times \frac{2}{5}\) (M1)
Note: Award (M1) for correct probabilities multiplied together.
\( = \frac{3}{{10}}\,\,\,\left( {0.3,\,\,30{\text{% }}} \right)\) (A1)(ft) (G2)
Note: Follow through from their tree diagram or part (a).[2 marks]
\(1 – \frac{3}{4} \times \frac{2}{5} \times \frac{3}{6}\) OR \(\frac{1}{4} + \frac{3}{4} \times \frac{2}{5} + \frac{3}{4} \times \frac{3}{5} \times \frac{3}{6}\) (M1)(M1)
Note: Award (M1) for \(\frac{3}{4} \times \frac{3}{5} \times \frac{3}{6}\) and (M1) for subtracting their correct probability from 1, or adding to their \(\frac{1}{4} + \frac{3}{4} \times \frac{2}{5}\).
\( = \frac{{93}}{{120}}\,\,\,\,\left( {\frac{{31}}{{40}},\,\,0.775,\,\,77.5{\text{% }}} \right)\) (A1)(ft) (G2)
Note: Follow through from their tree diagram.[3 marks]
\(\frac{3}{4} \times \frac{3}{5} \times \frac{3}{6} \times 120\) (M1)(M1)
Note: Award (M1) for \(\frac{3}{4} \times \frac{3}{5} \times \frac{3}{6}\,\,\,\,\left( {\frac{3}{4} \times \frac{3}{5} \times \frac{3}{6}\,\,{\text{OR}}\,\,\frac{{27}}{{120}}\,\,{\text{OR}}\,\,\frac{9}{{40}}} \right)\) and (M1) for multiplying by 120.
= 27 (A1)(ft) (G3)
Note: Follow through from their tree diagram or their \(\frac{3}{4} \times \frac{3}{5} \times \frac{3}{6}\) from their calculation in part (d)(ii).[3 marks]
Question
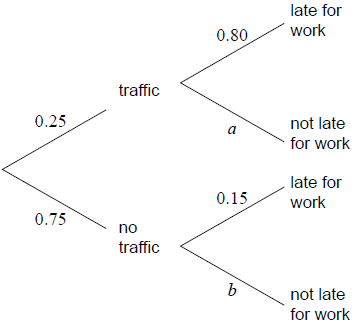
In a company it is found that 25 % of the employees encountered traffic on their way to work. From those who encountered traffic the probability of being late for work is 80 %.
From those who did not encounter traffic, the probability of being late for work is 15 %.
The tree diagram illustrates the information.
The company investigates the different means of transport used by their employees in the past year to travel to work. It was found that the three most common means of transport used to travel to work were public transportation (P ), car (C ) and bicycle (B ).
The company finds that 20 employees travelled by car, 28 travelled by bicycle and 19 travelled by public transportation in the last year.
Some of the information is shown in the Venn diagram.
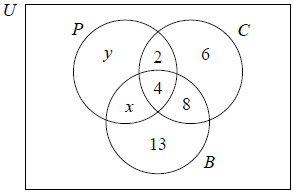
There are 54 employees in the company.
Write down the value of a.[1]
Write down the value of b.[1]
Use the tree diagram to find the probability that an employee encountered traffic and was late for work.[2]
Use the tree diagram to find the probability that an employee was late for work.[3]
Use the tree diagram to find the probability that an employee encountered traffic given that they were late for work.[3]
Find the value of x.[1]
Find the value of y.[1]
Find the number of employees who, in the last year, did not travel to work by car, bicycle or public transportation.[2]
Find \(n\left( {\left( {C \cup B} \right) \cap P’} \right)\).[2]
Answer/Explanation
Markscheme
a = 0.2 (A1)[1 mark]
b = 0.85 (A1)[1 mark]
0.25 × 0.8 (M1)
Note: Award (M1) for a correct product.
\( = 0.2\,\,\,\left( {\,\frac{1}{5},\,\,\,20\% } \right)\) (A1)(G2)[2 marks]
0.25 × 0.8 + 0.75 × 0.15 (A1)(ft)(M1)
Note: Award (A1)(ft) for their (0.25 × 0.8) and (0.75 × 0.15), (M1) for adding two products.
\( = 0.313\,\,\,\left( {0.3125,\,\,\,\frac{5}{{16}},\,\,\,31.3\% } \right)\) (A1)(ft)(G3)
Note: Award the final (A1)(ft) only if answer does not exceed 1. Follow through from part (b)(i).[3 marks]
\(\frac{{0.25 \times 0.8}}{{0.25 \times 0.8 + 0.75 \times 0.15}}\) (A1)(ft)(A1)(ft)
Note: Award (A1)(ft) for a correct numerator (their part (b)(i)), (A1)(ft) for a correct denominator (their part (b)(ii)). Follow through from parts (b)(i) and (b)(ii).
\( = 0.64\,\,\,\left( {\frac{{16}}{{25}},\,\,64{\text{% }}} \right)\) (A1)(ft)(G3)
Note: Award final (A1)(ft) only if answer does not exceed 1.[3 marks]
(x =) 3 (A1)[1 Mark]
(y =) 10 (A1)(ft)
Note: Following through from part (c)(i) but only if their x is less than or equal to 13.[1 Mark]
54 − (10 + 3 + 4 + 2 + 6 + 8 + 13) (M1)
Note: Award (M1) for subtracting their correct sum from 54. Follow through from their part (c).
= 8 (A1)(ft)(G2)
Note: Award (A1)(ft) only if their sum does not exceed 54. Follow through from their part (c).[2 marks]
6 + 8 + 13 (M1)
Note: Award (M1) for summing 6, 8 and 13.
27 (A1)(G2)[2 marks]