Question
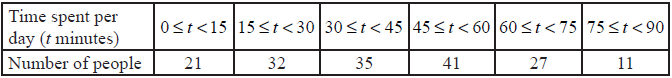
A random sample of 167 people who own mobile phones was used to collect data on the amount of time they spent per day using their phones. The results are displayed in the table below.
Manuel conducts a survey on a random sample of 751 people to see which television programme type they watch most from the following: Drama, Comedy, Film, News. The results are as follows.
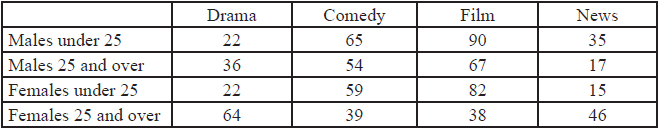
Manuel decides to ignore the ages and to test at the 5 % level of significance whether the most watched programme type is independent of gender.
State the modal group.[1]
Use your graphic display calculator to calculate approximate values of the mean and standard deviation of the time spent per day on these mobile phones.[3]
On graph paper, draw a fully labelled histogram to represent the data.[4]
Draw a table with 2 rows and 4 columns of data so that Manuel can perform a chi-squared test.[3]
State Manuel’s null hypothesis and alternative hypothesis.[1]
Find the expected frequency for the number of females who had ‘Comedy’ as their most-watched programme type. Give your answer to the nearest whole number.[2]
Using your graphic display calculator, or otherwise, find the chi-squared statistic for Manuel’s data.[3]
(i) State the number of degrees of freedom available for this calculation.
(ii) State his conclusion.[3]
Answer/Explanation
Markscheme
\(45 \leqslant t < 60\) (A1)[1 mark]
Unit penalty (UP) is applicable in question part (i)(b) only.
(UP) 42.4 minutes (G2)
21.6 minutes (G1)
[3 marks]
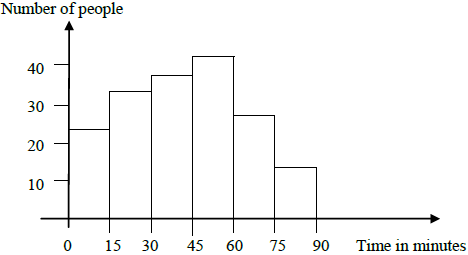 (A4)[4 marks]
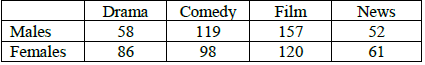 (M1)(M1)(A1)[3 marks]
H0: favourite TV programme is independent of gender or no association between favourite TV programme and gender
H1: favourite TV programme is dependent on gender (must have both) (A1)[1 mark]
\(\frac{{365 \times 217}}{{751}}\) (M1)
\(= 105\) (A1)(ft)(G2)[2 marks]
12.6 (accept 12.558) (G3)[3 marks]
(i) 3 (A1)
(ii) reject H0 or equivalent statement (e.g. accept H1) (A1)(ft)[3 marks]
Question
Jorge conducted a survey of \(200\) drivers. He asked two questions:
How long have you had your driving licence?
Do you wear a seat belt when driving?
The replies are summarized in the table below.
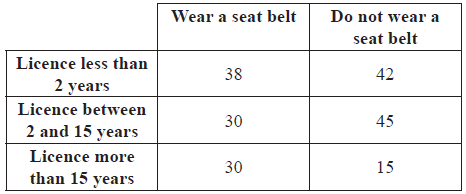
Jorge applies a \({\chi ^2}\) test at the \(5\% \) level to investigate whether wearing a seat belt is associated with the time a driver has had their licence.
(i) Write down the null hypothesis, \({{\text{H}}_0}\).
(ii) Write down the number of degrees of freedom.
(iii) Show that the expected number of drivers that wear a seat belt and have had their driving licence for more than \(15\) years is \(22\), correct to the nearest whole number.
(iv) Write down the \({\chi ^2}\) test statistic for this data.
(v) Does Jorge accept \({{\text{H}}_0}\) ? Give a reason for your answer.[8]
Consider the \(200\) drivers surveyed. One driver is chosen at random. Calculate the probability that
(i) this driver wears a seat belt;
(ii) the driver does not wear a seat belt, given that the driver has held a licence for more than \(15\) years.[4]
Two drivers are chosen at random. Calculate the probability that
(i) both wear a seat belt.
(ii) at least one wears a seat belt.[6]
Answer/Explanation
Markscheme
(i) \({{\text{H}}_0} = \) wearing of a seat belt and the time a driver has held a licence are independent. (A1)
Note: For independent accept ‘not associated’ but do not accept ‘not related’ or ‘not correlated’
(ii) \(2\) (A1)
(iii) \(\frac{{98 \times 45}}{{200}} = 22.05 = 22\) (correct to the nearest whole number) (M1)(A1)(AG)
Note: (M1) for correct formula and (A1) for correct substitution. Unrounded answer must be seen for the (A1) to be awarded.
(iv) \({\chi ^2} = 8.12\) (G2)
Note: For unrounded answer award (G1)(G0)(AP). If formula used award (M1) for correct substituted formula with correct substitution (6 terms) (A1) for correct answer.
(v) “Does not accept \({{\text{H}}_0}\)” (A1)(ft)
\(p{\text{-}}value < 0.05\) (R1)(ft)
Note: Allow “Reject \({{\text{H}}_0}\)” or equivalent. Follow through from their \({\chi ^2}\) statistic. Award (R1)(ft) for comparing the appropriate values. The (A1)(ft) can be awarded only if the conclusion is valid according to the comparison given. If no reason given or if reason is wrong the two marks are lost.[8 marks]
(i) \(\frac{{98}}{{200}}( = 0.49{\text{, }}49\% )\) (A1)(A1)(G2)
Note: (A1) for numerator, (A1) for denominator.
(ii) \(\frac{{15}}{{45}}( = 0.333{\text{, }}33.3\% )\) (A1)(A1)(G2)
Note: (A1) for numerator, (A1) for denominator.[4 marks]
(i) \(\frac{{98}}{{200}} \times \frac{{97}}{{199}} = 0.239{\text{ }}(23.9\% )\) (A1)(M1)(A1)(G3)
Note: (A1) for correct probabilities seen, (M1) for multiplying two probabilities, (A1) for correct answer.
(ii) \(1 – \frac{{102}}{{200}} \times \frac{{101}}{{199}} = 0.741{\text{ }}(74.1\% )\) (M1)(M1)(A1)(ft)(G2)
Note: (M1) for showing the product, (M1) for using the probability of the complement, (A1) for correct answer. Follow through for consistent use of with replacement.
OR
\(\frac{{98}}{{200}} \times \frac{{97}}{{199}} + \frac{{98}}{{200}} \times \frac{{102}}{{199}} + \frac{{102}}{{200}} \times \frac{{98}}{{199}} = 0.741{\text{ }}(74.1\% )\) (M1)(M1)(A1)(ft)(G2)
Note: (M1) for adding three products of fractions (or equivalent), (M1) for using the correct fractions, (A1) for correct answer. Follow through for consistent use of with replacement.[6 marks]
Question
A manufacturer claims that fertilizer has an effect on the height of rice plants. He measures the height of fertilized and unfertilized plants. The results are given in the following table.
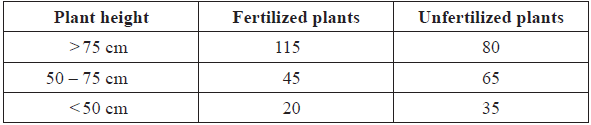
A chi-squared test is performed to decide if the manufacturer’s claim is justified at the 1 % level of significance.
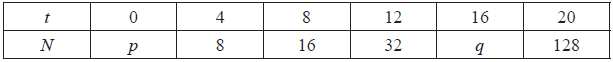
The population of fleas on a dog after t days, is modelled by
\[N = 4 \times {(2)^{\frac{t}{4}}},{\text{ }}t \geqslant 0\]
Some values of N are shown in the table below.
Write down the null and alternative hypotheses for this test.[2]
For the number of fertilized plants with height greater than 75 cm, show that the expected value is 97.5.[3]
Write down the value of \(\chi_{calc}^2\).[2]
Write down the number of degrees of freedom.[1]
Is the manufacturer’s claim justified? Give a reason for your answer.[2]
Write down the value of p.[1]
Write down the value of q.[2]
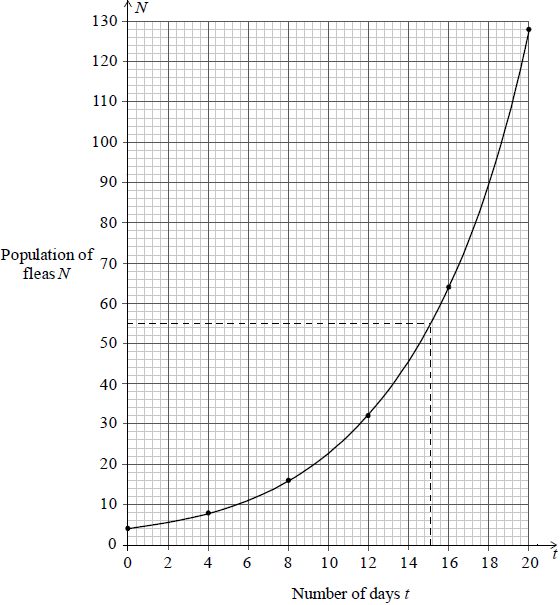
Using the values in the table above, draw the graph of N for 0 ≤ t ≤ 20. Use 1 cm to represent 2 days on the horizontal axis and 1 cm to represent 10 fleas on the vertical axis.[6]
Use your graph to estimate the number of days for the population of fleas to reach 55.[2]
Answer/Explanation
Markscheme
H0: The height of the rice plants is independent of the use of a fertilizer. (A1)
Notes: For independent accept “not associated”, can accept “the use of a fertilizer has no effect on the height of the plants”.
Do not accept “not correlated”.
H1: The height of the rice plants is not independent (dependent) of the use of fertilizer. (A1)(ft)
Note: If H0 and H1 are reversed award (A0)(A1)(ft).[2 marks]
\(\frac{{180 \times 195}}{{360}}\) or \(\frac{{180}}{{360}} \times \frac{{195}}{{360}} \times 360\) (A1)(A1)(M1)
= 97.5 (AG)
Notes: Award (A1) for numerator, (A1) for denominator (M1) for division.
If final 97.5 is not seen award at most (A1)(A0)(M1).[3 marks]
\( \chi_{calc}^2 = 14.01 (14.0, 14)\) (G2)
OR
If worked out by hand award (M1) for correct substituted formula with correct values, (A1) for correct answer. (M1)(A1)[2 marks]
2 (A1)[1 mark]
\( \chi_{calc}^2 > \chi_{crit}^2\) (R1)
The manufacturer’s claim is justified. (or equivalent statement) (A1)
Note: Do not accept (R0)(A1).[2 marks]
\(p = 4\) (G1)[1 mark]
\(q = 4(2)^{\frac{16}{4}}\) (M1)
\(= 64\) (A1)(G2)[2 marks]
 (A1)(A1)(A1) (A3)
Notes: Award (A1) for x axis with correct scale and label, (A1) for y axis with correct scale and label.
Accept x and y for labels.
If x and y axis reversed award at most (A0)(A1)(ft).
(A1) for smooth curve.
Award (A3) for all 6 points correct, (A2) for 4 or 5 points correct, (A1) for 2 or 3 points correct, (A0) otherwise.[6 marks]
15 (±0.8) (M1)(A1)(ft)(G2)
Note: Award (M1) for line drawn shown on graph, (A1)(ft) from candidate’s graph.[2 marks]
Question
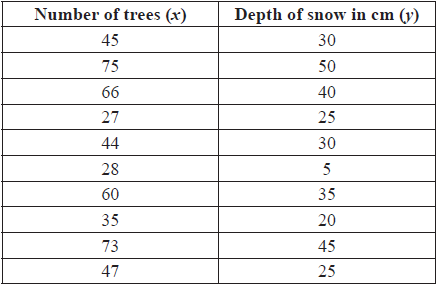
In a mountain region there appears to be a relationship between the number of trees growing in the region and the depth of snow in winter. A set of 10 areas was chosen, and in each area the number of trees was counted and the depth of snow measured. The results are given in the table below.
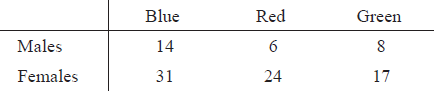
In a study on \(100\) students there seemed to be a difference between males and females in their choice of favourite car colour. The results are given in the table below. A \(\chi^2\) test was conducted.
Use your graphic display calculator to find the mean number of trees.[1]
Use your graphic display calculator to find the mean depth of snow.[1]
Use your graphic display calculator to find the standard deviation of the depth of snow.[1]
The covariance, Sxy = 188.5.
Write down the product-moment correlation coefficient, r.[2]
Write down the equation of the regression line of y on x.[2]
If the number of trees in an area is 55, estimate the depth of snow.[2]
Use the equation of the regression line to estimate the depth of snow in an area with 100 trees.[1]
Decide whether the answer in (e)(i) is a valid estimate of the depth of snow in the area. Give a reason for your answer.[2]
Write down the total number of male students.[1]
Show that the expected frequency for males, whose favourite car colour is blue, is 12.6.[2]
The calculated value of \({\chi ^2}\) is \(1.367\) and the critical value of \({\chi ^2}\) is \(5.99\) at the \(5\%\) significance level.
Write down the null hypothesis for this test.[1]
The calculated value of \({\chi ^2}\) is \(1.367\) and the critical value of \({\chi ^2}\) is \(5.99\) at the \(5\%\) significance level.
Write down the number of degrees of freedom.[1]
The calculated value of \({\chi ^2}\) is \(1.367\) and the critical value of \({\chi ^2}\) is \(5.99\) at the \(5\%\) significance level.
Determine whether the null hypothesis should be accepted at the \(5\%\) significance level. Give a reason for your answer.[2]
Answer/Explanation
Markscheme
50 (G1)[1 mark]
30.5 (G1)[1 mark]
12.3 (G1)
Note: Award (A1)(ft) for 13.0 in (iv) but only if 17.7 seen in (a)(ii).[1 mark]
\(r = \frac{{188.5}}{{(16.79 \times 12.33)}}\) (M1)
Note: Award (M1) for using their values in the correct formula.
= 0.911 (accept 0.912, 0.910) (A1)(ft)(G2)[2 marks]
y = 0.669x − 2.95 (G1)(G1)
Note: Award (G1) for 0.669x, (G1) for −2.95. If the answer is not in the form of an equation, award at most (G1)(G0).[2 marks]
Depth = 0.669 × 55 − 2.95 (M1)
= 33.8 (A1)(ft)(G2)(ft)
Note: Follow through from their (c) even if no working seen.[2 marks]
64.0 (accept 63.95, 63.9) (A1)(ft)(G1)(ft)
Note: Follow through from their (c) even if no working seen.[1 mark]
It is not valid. It lies too far outside the values that are given. Or equivalent. (A1)(R1)
Note: Do not award (A1)(R0).[2 marks]
28 (A1)[1 mark]
\(\frac{{28 \times 45}}{{100}}\left( {\frac{{28}}{{100}} \times \frac{{45}}{{100}} \times 100} \right)\) (M1)(A1)(ft)
Note: Award (M1) for correct formula, (A1) for correct substitution.
= 12.6 (AG)
Note: Do not award (A1) unless 12.6 seen.[2 marks]
the favourite car colour is independent of gender. (A1)
Note: Accept there is no association between gender and favourite car colour.
Do not accept ‘not related’ or ‘not correlated’.[1 mark]
\(2\) (A1)[1 marks]
Accept the null hypothesis since \(1.367 < 5.991\) (A1)(ft)(R1)
Note: Allow “Do not reject”. Follow through from their null hypothesis and their critical value.
Full credit for use of \(p\)-values from GDC [\(p = 0.505\)].
Do not award (A1)(R0). Award (R1) for valid comparison.[2 marks]
Question
Part A
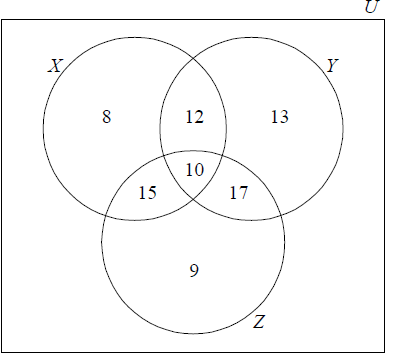
100 students are asked what they had for breakfast on a particular morning. There were three choices: cereal (X) , bread (Y) and fruit (Z). It is found that
10 students had all three
17 students had bread and fruit only
15 students had cereal and fruit only
12 students had cereal and bread only
13 students had only bread
8 students had only cereal
9 students had only fruit
Part B
The same 100 students are also asked how many meals on average they have per day. The data collected is organized in the following table.
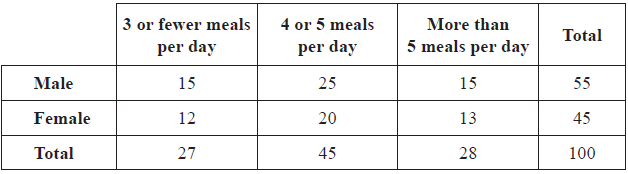
A \({\chi ^2}\) test is carried out at the 5 % level of significance.
Represent this information on a Venn diagram.[4]
Find the number of students who had none of the three choices for breakfast.[2]
Write down the percentage of students who had fruit for breakfast.[2]
Describe in words what the students in the set \(X \cap Y’\) had for breakfast.[2]
Find the probability that a student had at least two of the three choices for breakfast.[2]
Two students are chosen at random. Find the probability that both students had all three choices for breakfast.[3]
Write down the null hypothesis, H0, for this test.[1]
Write down the number of degrees of freedom for this test.[1]
Write down the critical value for this test.[1]
Show that the expected number of females that have more than 5 meals per day is 13, correct to the nearest integer.[2]
Use your graphic display calculator to find the \(\chi _{calc}^2\) for this data.[2]
Decide whether H0 must be accepted. Justify your answer.[2]
Answer/Explanation
Markscheme
(A1) for rectangle and three intersecting circles
(A1) for 10, (A1) for 8, 13 and 9, (A1) for 12, 15 and 17 (A4)[4 marks]
100 – (9 +12 +13 +15 +10 +17 + 8) =16 (M1)(A1)(ft)(G2)
Note: Follow through from their diagram.[2 marks]
\(\frac{{51}}{{100}}(0.51)\) (A1)(ft)
= 51% (A1)(ft)(G2)
Note: Follow through from their diagram.[2 marks]
Note: The following statements are correct. Please note that the connectives are important. It is not the same (had cereal) and (not bread) and (had cereal) or (not bread). The parentheses are not needed but are there to facilitate the understanding of the propositions.
(had cereal) and (did not have bread)
(had cereal only) or (had cereal and fruit only)
(had either cereal or (fruit and cereal)) and (did not have bread) (A1)(A1)
Notes: If the statements are correct but the connectives are wrong then award at most (A1)(A0). For the statement (had only cereal) and (cereal and fruit) award (A1)(A0). For the statement had cereal and fruit award (A0)(A0).[2 marks]
\(\frac{{54}}{{100}}(0.54,{\text{ 54 % }})\) (A1)(ft)(A1)(ft)(G2)
Note: Award (A1)(ft) for numerator, follow through from their diagram, (A1)(ft) for denominator. Follow through from total or denominator used in part (c).[2 marks]
\(\frac{{10}}{{100}} \times \frac{9}{{99}} = \frac{1}{{110}}(0.00909,{\text{ 0}}{\text{.909 % }})\) (A1)(ft)(M1)(A1)(ft)(G2)
Notes: Award (A1)(ft) for their correct fractions, (M1) for multiplying two fractions, (A1)(ft) for their correct answer. Answer 0.009 with no working receives no marks. Follow through from denominator in parts (c) and (e) and from their diagram.[3 marks]
H0 : The (average) number of meals per day a student has and gender are independent (A1)
Note: For “independent” accept “not associated” but do not accept “not related” or “not correlated”.[1 mark]
2 (A1)[1 mark]
5.99 (accept 5.991) (A1)(ft)
Note: Follow through from their part (b).[1 mark]
\(\frac{{28 \times 45}}{{100}} = 12.6 = 13\) or \(\frac{{28}}{{100}} \times \frac{{25}}{{100}} \times 100 = 12.6 = 13\) (M1)(A1)(AG)
Notes: Award (M1) for correct formula and (A1) for correct substitution. Unrounded answer must be seen for the (A1) to be awarded.[2 marks]
0.0321 (G2)
Note: For 0.032 award (G1)(G1)(AP). For 0.03 with no working award (G0).[2 marks]
0.0321 < 5.99 or 0.984 > 0.05 (R1)
accept H0 (A1)(ft)
Note: If reason is incorrect both marks are lost, do not award (R0)(A1).[2 marks]
Question
One day the numbers of customers at three cafés, “Alan’s Diner” ( \(A\) ), “Sarah’s Snackbar” ( \(S\) ) and “Pete’s Eats” ( \(P\) ), were recorded and are given below.
17 were customers of Pete’s Eats only
27 were customers of Sarah’s Snackbar only
15 were customers of Alan’s Diner only
10 were customers of Pete’s Eats and Sarah’s Snackbar but not Alan’s Diner
8 were customers of Pete’s Eats and Alan’s Diner but not Sarah’s Snackbar
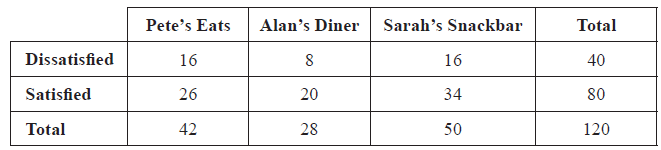
Some of the customers in each café were given survey forms to complete to find out if they were satisfied with the standard of service they received.
Draw a Venn Diagram, using sets labelled \(A\) , \(S\) and \(P\) , that shows this information.[3]
There were 48 customers of Pete’s Eats that day. Calculate the number of people who were customers of all three cafés.[2]
There were 50 customers of Sarah’s Snackbar that day. Calculate the total number of people who were customers of Alan’s Diner.[3]
Write down the number of customers of Alan’s Diner that were also customers of Pete’s Eats.[1]
Find \(n[(S \cup P) \cap A’]\).[2]
One of the survey forms was chosen at random, find the probability that the form showed “Dissatisfied”;[2]
One of the survey forms was chosen at random, find the probability that the form showed “Satisfied” and was completed at Sarah’s Snackbar;[2]
One of the survey forms was chosen at random, find the probability that the form showed “Dissatisfied”, given that it was completed at Alan’s Diner.[2]
A \({\chi ^2}\) test at the \(5\% \) significance level was carried out to determine whether there was any difference in the level of customer satisfaction in each of the cafés.
Write down the null hypothesis, \({{\text{H}}_0}\) , for the \({\chi ^2}\) test.[1]
A \({\chi ^2}\) test at the \(5\% \) significance level was carried out to determine whether there was any difference in the level of customer satisfaction in each of the cafés.
Write down the number of degrees of freedom for the test.[1]
A \({\chi ^2}\) test at the \(5\% \) significance level was carried out to determine whether there was any difference in the level of customer satisfaction in each of the cafés.
Using your graphic display calculator, find \({\chi ^2}_{calc}\) .[2]
A \({\chi ^2}\) test at the \(5\% \) significance level was carried out to determine whether there was any difference in the level of customer satisfaction in each of the cafés.
State, giving a reason, the conclusion to the test.[2]
Answer/Explanation
Markscheme
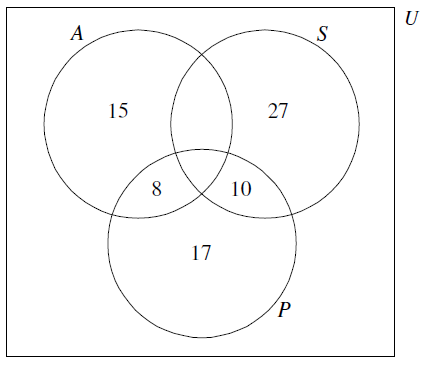
(A1) for rectangle and three labelled intersecting circles
(A1) for \(15\), \(27\) and \(17\)
(A1) for \(10\) and \(8\) (A3)[3 marks]
\(48 – (8 +10 +17)\) or equivalent (M1)
\( = 13\) (A1)(ft)(G2)[2 marks]
\(50 – (27 +10 +13)\) (M1)
Note: Award (M1) for working seen.
\( = 0\) (A1)
number of elements in A \(= 36\) (A1)(ft)(G3)
Note: Follow through from (b).[3 marks]
\(21\) (A1)(ft)
Note: Follow through from (b) even if no working seen.[1 mark]
\(54\) (M1)(A1)(ft)(G2)
Note: Award (M1) for \(17\), \(10\), \(27\) seen. Follow through from (a).[2 marks]
\(\frac{{40}}{{120}}{\text{ }}\left( {\frac{1}{3}{\text{, }}0.333{\text{, }}33.3\% } \right)\) (A1)(A1)(G2)
Note: Award (A1) for numerator, (A1) for denominator.[2 marks]
\(\frac{{34}}{{120}}{\text{ }}\left( {\frac{{17}}{{60}}{\text{, }}0.283{\text{, }}28.3\% } \right)\) (A1)(A1)(G2)
Note: Award (A1) for numerator, (A1) for denominator.[2 marks]
\(\frac{8}{{28}}{\text{ }}\left( {\frac{2}{7}{\text{, }}0.286{\text{, }}28.6\% } \right)\) (A1)(A1)(G2)
Note: Award (A1) for numerator, (A1) for denominator.[2 marks]
customer satisfaction is independent of café (A1)
Note: Accept “customer satisfaction is not associated with the café”.[1 mark]
\(2\) (A1)[1 mark]
\(0.754\) (G2)
Note: Award (G1)(G1)(AP) for \(0.75\) or for correct answer incorrectly rounded to 3 s.f. or more, (G0) for \(0.7\).[2 marks]
since \({\chi ^2}_{calc} < {\chi ^2}_{crit}5.991 accept (or Do not reject) H0 (R1)(A1)(ft)
Note: Follow through from their value in (e).
OR
Accept (or Do not reject) H0 as \(p\)-value \((0.686) > 0.05\) (R1)(A1)(ft)
Notes: Do not award (A1)(R0). Award the (R1) for comparison of appropriate values.[2 marks]
Question
Part A
A university required all Science students to study one language for one year. A survey was carried out at the university amongst the 150 Science students. These students all studied one of either French, Spanish or Russian. The results of the survey are shown below.
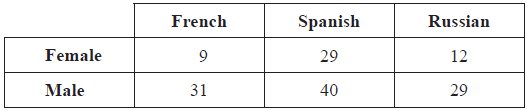
Ludmila decides to use the \({\chi ^2}\) test at the \(5\% \) level of significance to determine whether the choice of language is independent of gender.
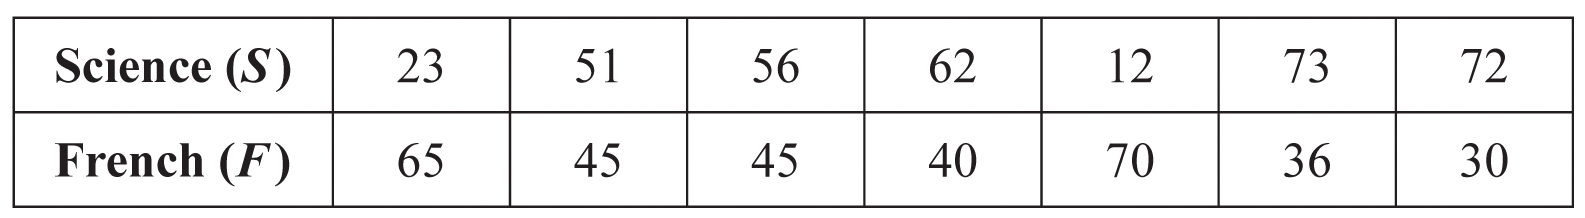
At the end of the year, only seven of the female Science students sat examinations in Science and French. The marks for these seven students are shown in the following table.
State Ludmila’s null hypothesis.[1]
Write down the number of degrees of freedom.[1]
Find the expected frequency for the females studying Spanish.[2]
Use your graphic display calculator to find the \({\chi ^2}\) test statistic for this data.[2]
State whether Ludmila accepts the null hypothesis. Give a reason for your answer.[2]
Draw a labelled scatter diagram for this data. Use a scale of \(2{\text{ cm}}\) to represent \(10{\text{ marks}}\) on the \(x\)-axis (\(S\)) and \(10{\text{ marks}}\) on the \(y\)-axis (\(F\)).[4]
Use your graphic calculator to find
(i) \({\bar S}\), the mean of \(S\) ;
(ii) \({\bar F}\), the mean of \(F\) .[2]
Plot the point \({\text{M}}(\bar S{\text{, }}\bar F)\) on your scatter diagram.[1]
Use your graphic display calculator to find the equation of the regression line of \(F\) on \(S\) .[2]
Draw the regression line on your scatter diagram.[2]
Carletta’s mark on the Science examination was \(44\). She did not sit the French examination.
Estimate Carletta’s mark for the French examination.[2]
Monique’s mark on the Science examination was 85. She did not sit the French examination. Her French teacher wants to use the regression line to estimate Monique’s mark.
State whether the mark obtained from the regression line for Monique’s French examination is reliable. Justify your answer.[2]
Answer/Explanation
Markscheme
\({{\text{H}}_0}:\) Choice of language is independent of gender. (A1)
Notes: Do not accept “not related” or “not correlated”.[1 mark]
\(2\) (A1)[1 mark]
\(\frac{{50 \times 69}}{{150}} = 23\) (M1)(A1)(G2)
Notes: Award (M1) for correct substituted formula, (A1) for \(23\).[2 marks]
\({\chi ^2} = 4.77\) (G2)
Notes: If answer is incorrect, award (M1) for correct substitution in the correct formula (all terms).[2 marks]
Accept \({{\text{H}}_0}\) since
\({\chi ^2}_{calc} < {\chi ^2}_{crit}(5.99)\) or \(p\)-value \((0.0923) > 0.05\) (R1)(A1)(ft)
Notes: Do not award (R0)(A1). Follow through from their (d) and (b).
Award (A1) for correct scale and labels.
Award (A3) for all seven points plotted correctly, (A2) for 5 or 6 points plotted correctly, (A1) for 3 or 4 points plotted correctly.
(A4)[4 marks]
(i) \({\bar S}= 49.9\), (G1)
(ii) \({\bar F} = 47.3\) (G1)[2 marks]
\({\text{M}}(49.9{\text{, }}47.3)\) plotted on scatter diagram (A1)(ft)
Notes: Follow through from (a) and (b).[1 mark]
\(F = – 0.619S + 78.2\) (G1)(G1)
Notes: Award (G1) for \( – 0.619S\), (G1) for \(78.2\). If the answer is not in the form of an equation, award (G1)(G0). Accept \(y = – 0.619x + 78.2\) .
OR
(F – 47.3 = – 0.619(S – 49.9)) (G1)(G1)
Note: Award (G1) for \( – 0.619\), (G1) for the coordinates of their midpoint used. Follow through from their values in (b).[2 marks]
line drawn on scatter diagram (A1)(ft)(A1)(ft)
Notes: The drawn line must be straight for any marks to be awarded. Award (A1)(ft) passing through their M plotted in (c). Award (A1)(ft) for correct \(y\)-intercept. Follow through from their \(y\)-intercept found in (d).[2 marks]
\(F = – 0.619 \times 44 + 78.2\) (M1)
\(= 51.0\) (allow \(51\) or \(50.9\)) (A1)(ft)(G2)(ft)
Note: Follow through from their equation.
OR
(M1) any indication of an acceptable graphical method. (M1)
(A1)(ft) from their regression line. (A1)(ft)(G2)(ft)[2 marks]
not reliable (A1)
Monique’s score in Science is outside the range of scores used to create the regression line. (R1)
Note: Do not award (A1)(R0).[2 marks]
Question
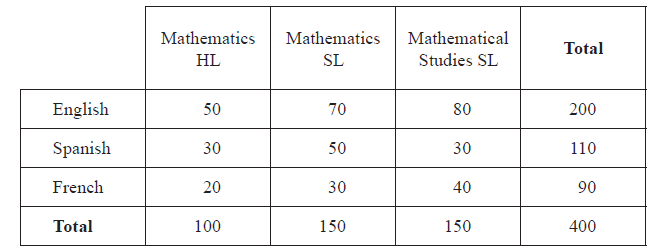
Pam has collected data from a group of 400 IB Diploma students about the Mathematics course they studied and the language in which they were examined (English, Spanish or French). The summary of her data is given below.
A student is chosen at random from the group. Find the probability that the student
(i) studied Mathematics HL;
(ii) was examined in French;
(iii) studied Mathematics HL and was examined in French;
(iv) did not study Mathematics SL and was not examined in English;
(v) studied Mathematical Studies SL given that the student was examined in Spanish.[8]
Pam believes that the Mathematics course a student chooses is independent of the language in which the student is examined.
Using your answers to parts (a) (i), (ii) and (iii) above, state whether there is any evidence for Pam’s belief. Give a reason for your answer.[2]
Pam decides to test her belief using a Chi-squared test at the \(5\% \) level of significance.
(i) State the null hypothesis for this test.
(ii) Show that the expected number of Mathematical Studies SL students who took the examination in Spanish is \(41.3\), correct to 3 significant figures.[3]
Write down
(i) the Chi-squared calculated value;
(ii) the number of degrees of freedom;
(iii) the Chi-squared critical value.[4]
State, giving a reason, whether there is sufficient evidence at the \(5\% \) level of significance that Pam’s belief is correct.[2]
Answer/Explanation
Markscheme
(i) \(\frac{{100}}{{400}}{\text{ }}\left( {\frac{1}{4}{\text{, }}0.25{\text{, }}25\% } \right)\) (A1)
(ii) \(\frac{{90}}{{400}}{\text{ }}\left( {\frac{9}{{40}}{\text{, }}0.225{\text{, }}22.5\% } \right)\) (A1)
(iii) \(\frac{{20}}{{400}}{\text{ }}\left( {\frac{1}{{20}}{\text{, }}0.05{\text{, }}5\% } \right)\) (A1)(A1)
Note: Award (A1) for numerator, (A1) for denominator.
(iv) \(\frac{{120}}{{400}}{\text{ }}\left( {\frac{3}{{10}}{\text{, }}0.3{\text{, }}30\% } \right)\) (A1)(A1)
Note: Award (A1) for numerator, (A1) for denominator.
(v) \(\frac{{30}}{{110}}{\text{ }}\left( {\frac{3}{{11}}{\text{, }}0.273{\text{, }}27.3\% } \right)\) (\(0.272727 \ldots \)) (A1)(A1)
Note: Award (A1) for numerator, (A1) for denominator. Accept \(0.27\), do not accept \(0.272\), do not accept \(0.3\).[8 marks]
\(\frac{1}{{20}} \ne \frac{1}{4} \times \frac{9}{{40}}\) (R1)(ft)
Note: The fractions must be used as part of the reason. Follow through from (a)(i), (a)(ii) and (a)(iii).
Pam is not correct. (A1)(ft)
Notes: Do not award (R0)(A1). Accept the events are not independent (dependent).[2 marks]
(i) The mathematics course and language of examination are independent. (A1)
Notes: Accept “There is no association between Mathematics course and language”. Do not accept “not related”, “not correlated”, “not influenced”.
(ii) \(\frac{{110}}{{400}} \times \frac{{150}}{{400}} \times 400{\text{ }}\left( { = \frac{{110 \times 150}}{{400}}} \right)\) (M1)
\( = 41.25\) (A1)
\( = 41.3\) (AG)
Note: \(41.25\) and \(41.3\) must be seen to award final (A1).[3 marks]
(i) \(7.67\) (\(7.67003 \ldots \)) (G2)
Note: Accept \(7.7\), do not accept \(8\) or \(7.6\). Award (G1) if formula with all nine terms seen but their answer is not one of those above.
(ii) \(4\) (G1)
(iii) \(9.488\) (A1)(ft)
Notes: Accept \(9.49\) or \(9.5\), do not accept \(9.4\) or \(9\). Follow through from their degrees of freedom.[4 marks]
\(7.67 < 9.488\) (R1)
OR
\(p = 0.104 \ldots , p > 0.05\) (R1)
Accept (Do not reject) \({H_0}\) (Pam’s belief is correct) (A1)(ft)
Notes: Follow through from part (d). Do not award (R0)(A1).[2 marks]
Question
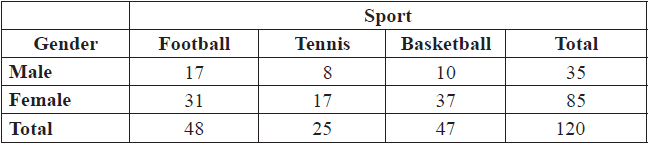
The seniors from Gulf High School are required to participate in exactly one after-school sport. Data were gathered from a sample of 120 students regarding their choice of sport. The following data were recorded.
A \({\chi ^2}\) test was carried out at the 5 % significance level to analyse the relationship between gender and choice of after-school sport.
Write down the null hypothesis, H0, for this test.[1]
Find the expected value of female footballers.[2]
Write down the number of degrees of freedom.[1]
Write down the critical value of \(\chi ^2\), at the 5 % level of significance.[1]
Use your graphic display calculator to determine the \(\chi _{calc}^2\) value.[2]
Determine whether H0 should be accepted. Justify your answer.[2]
One student is chosen at random from the 120 students.
Find the probability that this student
(i) is male;
(ii) plays tennis.[2]
Two students are chosen at random from the 120 students.
Find the probability that
(i) both play football;
(ii) neither play basketball.[5]
Answer/Explanation
Markscheme
H0 : Gender and choice of afterschool sport are independent. (A1)
Note: Accept “not associated”, do not accept “not related”, “not correlated”, or “not linked”. Accept “the relation between gender and sport is independent”.[1 mark]
\(\frac{{85}}{{120}} \times \frac{{48}}{{120}} \times 120\left( {\frac{{85 \times 48}}{{120}}} \right)\) (M1)
Note: Award (M1) for correct expression.
= 34 (A1)(G2)[2 marks]
2 (A1)[1 mark]
5.99 (5.991) (A1)(ft)
Note: Follow through from part (c).[1 mark]
2.42 (2.42094…) (G2)[2 marks]
Since 2.42 < 5.99 therefore accept (do not reject) H0 (R1)(A1)(ft)
Note: The numerical values need not be seen, but must be consistent with their parts (d) and (e).
OR
p-value 0.298 > 0.05 therefore accept (do not reject) H0 (R1)(A1)
Note: p-value comparison may not be used as part of a follow through solution. Do not award (A1)(R0). Follow through from parts (c), (d) and (e).[2 marks]
(i) \(\frac{{35}}{{120}}\left( {\frac{7}{{24}},{\text{ }}0.292,{\text{ }}29.2\% } \right)\) (0.291666…) (A1)
(ii) \(\frac{{25}}{{120}}\left( {\frac{5}{{24}},{\text{ }}0.208,{\text{ }}20.8\% } \right)\) (0.208333…) (A1)[2 marks]
(i) \(\frac{{48}}{{120}} \times \frac{{47}}{{119}}\) (A1)(M1)
Note: Award (A1) for two correct fractions, (M1) for multiplying their two fractions.
\( = \frac{{94}}{{595}}(0.158,{\text{ }}15.8\% )\) (0.157983…) (A1)(G2)
(ii) \(\frac{{73}}{{120}} \times \frac{{72}}{{119}}\) (M1)
Note: Award (M1) for multiplying correct fractions. If sampling with replacement has been used in both parts (h)(i) and (h)(ii) do not penalise in part (h)(ii). Award a maximum of (M1)(A1)(ft).
\( = \frac{{219}}{{595}}(0.368,{\text{ }}36.8\% )\) (0.368067…) (A1)(G2)[5 marks]
Question
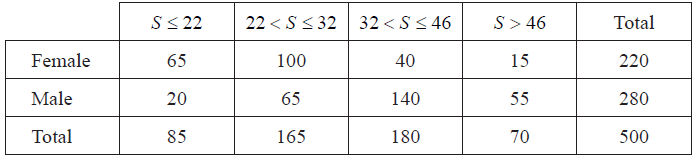
A store recorded their sales of televisions during the 2010 football World Cup. They looked at the numbers of televisions bought by gender and the size of the television screens.
This information is shown in the table below; S represents the size of the television screen in inches.
The store wants to use this information to predict the probability of selling these sizes of televisions for the 2014 football World Cup.
Use the table to find the probability that
(i) a television will be bought by a female;
(ii) a television with a screen size of 32 < S ≤ 46 will be bought;
(iii) a television with a screen size of 32 < S ≤ 46 will be bought by a female;
(iv) a television with a screen size greater than 46 inches will be bought, given that it is bought by a male.[6]
The manager of the store wants to determine whether the screen size is independent of gender. A Chi-squared test is performed at the 1 % significance level.
Write down the null hypothesis.[1]
The manager of the store wants to determine whether the screen size is independent of gender. A Chi-squared test is performed at the 1 % significance level.
Show that the expected frequency for females who bought a screen size of 32 < S ≤ 46, is 79, correct to the nearest integer.[2]
The manager of the store wants to determine whether the screen size is independent of gender. A Chi-squared test is performed at the 1 % significance level.
Write down the number of degrees of freedom.[1]
The manager of the store wants to determine whether the screen size is independent of gender. A Chi-squared test is performed at the 1 % significance level.
Write down the \({\chi ^2}\) calculated value.[2]
The manager of the store wants to determine whether the screen size is independent of gender. A Chi-squared test is performed at the 1 % significance level.
Write down the critical value for this test.[1]
The manager of the store wants to determine whether the screen size is independent of gender. A Chi-squared test is performed at the 1 % significance level.
Determine if the null hypothesis should be accepted. Give a reason for your answer.[2]
Answer/Explanation
Markscheme
(i) \(\frac{{220}}{{500}}\left( {\frac{{11}}{{25}},{\text{ 0}}{\text{.44, 44}}\% } \right)\) (A1)(G1)
(ii) \(\frac{{180}}{{500}}\left( {\frac{{9}}{{25}},{\text{ 0}}{\text{.36, 36}}\% } \right)\) (A1)(G1)
(iii) \(\frac{{40}}{{500}}\left( {\frac{{2}}{{25}},{\text{ 0}}{\text{.08, 8}}\% } \right)\) (A1)(A1)(G2)
(iv) \(\frac{{55}}{{500}}\left( {\frac{{11}}{{56}},{\text{ 0}}{\text{.196, 19.6}}\% } \right)\) (A1)(A1)(G2)
Note: Award (A1) for numerator, (A1) for denominator. Award (A0)(A0) if answers are given as incorrect reduced fractions without working.[6 marks]
“The size of the television screen is independent of gender.” (A1)
Note: Accept “not associated”, do not accept “not correlated”.[1 mark]
\(\frac{{180}}{{500}} \times \frac{{220}}{{500}} \times 500\) OR \(\frac{{180 \times 220}}{{500}}\) (M1)
= 79.2 (A1)
= 79 (AG)
Note: Both the unrounded and the given answer must be seen for the final (A1) to be awarded.[2 marks]
3 (A1)[1 mark]
\(\chi _{calc}^2\) = 104(103.957…) (G2)
Note: Award (M1) if an attempt at using the formula is seen but incorrect answer obtained.[2 marks]
11.345 (A1)(ft)
Notes: Follow through from their degrees of freedom.[1 mark]
\(\chi _{calc}^2\) > \(\chi _{crit}^2\) OR p < 0.01 (R1)
Do not accept H0. (A1)(ft)
Note: Do not award (R0)(A1)(ft). Follow through from their parts (d), (e) and (f).[2 marks]
Question
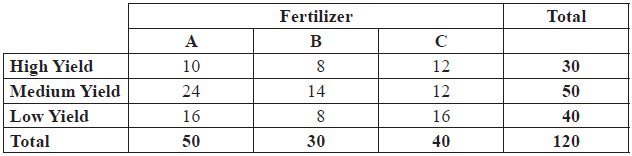
An agricultural cooperative uses three brands of fertilizer, A, B and C, on 120 different crops. The crop yields are classified as High, Medium or Low.
The data collected are organized in the table below.
The agricultural cooperative decides to conduct a chi-squared test at the 1 % significance level using the data.
State the null hypothesis, H0, for the test.[2]
Write down the number of degrees of freedom.[1]
Write down the critical value for the test.[1]
Show that the expected number of Medium Yield crops using Fertilizer C is 17, correct to the nearest integer.[2]
Use your graphic display calculator to find for the data
(i) the \(\chi^2\) calculated value, \(\chi _{calc}^2\);
(ii) the p-value.[3]
State the conclusion of the test. Give a reason for your decision.[2]
Answer/Explanation
Markscheme
The (crop) yield is independent of the (type of) fertilizer used. (A1)(A1)
Note: Award (A1) for (crop) yield and (type of) fertilizer, (A1) for “independent” or “not dependent” or “not associated”.
Do not accept “not correlated” or “not related” or “not connected” or “does not depend on”.
4 (A1)
13.277 (A1)(ft)
Note: Accept 13.3. Follow through from part (b).
\(\frac{{50}}{{120}} \times \frac{{40}}{{120}} \times 120\) or \(\frac{{50 \times 40}}{{120}}\) (M1)
Note: Award (M1) for correct substitution in the expected value formula.
= 16.6666… (A1)
= 17 (AG)
Note: Both unrounded and rounded answers must be seen to award (A1).
(i) \(\chi_{calc}^2 = 3.86 (3.86133…)\) (G2)
(ii) p-value \( = 0.425\) (\(0.425097…\)) (G1)
Since \(\chi_{calc}^2\) < Critical Value (R1)
Accept (do not reject) the Null Hypothesis. (A1)(ft)
Note: Accept decision based on p-value with comparison to 1 % (0.425097… > 0.01) . Do not award (R0)(A1). Follow through from parts (c) and (e). Numerical answers must be present in the question for a valid comparison to be made.
Question
In a debate on voting, a survey was conducted. The survey asked people’s opinion on whether or not the minimum voting age should be reduced to 16 years of age. The results are shown as follows.
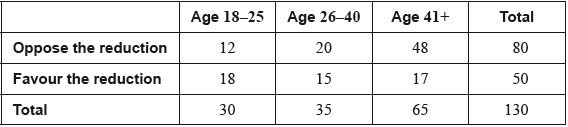
A \({\chi ^2}\) test at the 1% significance level was conducted. The \({\chi ^2}\) critical value of the test is 9.21.
State
(i) \({{\text{H}}_0}\), the null hypothesis for the test;
(ii) \({{\text{H}}_1}\), the alternative hypothesis for the test.[2]
Write down the number of degrees of freedom.[1]
Show that the expected frequency of those between the ages of 26 and 40 who oppose the reduction in the voting age is 21.5, correct to three significant figures.[2]
Find
(i) the \({\chi ^2}\) statistic;
(ii) the associated \(p\)-value for the test.[3]
Determine, giving a reason, whether \({{\text{H}}_0}\) should be accepted.[2]
Answer/Explanation
Markscheme
(i) \({{\text{H}}_0}\) age and opinion (about the reduction) are independent. (A1)
Notes: Accept “not associated” instead of independent.
(ii) \({{\text{H}}_1}\) age and opinion are not independent. (A1)(ft)
Notes: Follow through from part (a)(i). Accept “associated” or “dependent”.
Award (A1)(ft) for their correct \({{\text{H}}_1}\) worded consistently with their part (a)(i).
\(2\) (A1)
\(\frac{{80}}{{130}} \times \frac{{35}}{{130}} \times 130\;\;\;\)OR\(\;\;\;\frac{{80 \times 35}}{{130}}\) (M1)
Note: Award (M1) for \(\frac{{80}}{{130}} \times \frac{{35}}{{130}} \times 130\;\;\;\)OR\(\;\;\;\frac{{80 \times 35}}{{130}}\) seen. The following (A1) cannot be awarded without this statement.
\( = 21.5384 \ldots \) (A1)
\( = 21.5\) (AG)
Note: Both an unrounded answer that rounds to the given answer and rounded must be seen for the (A1) to be awarded. Accept \(21.54\) or \(21.53\) as an unrounded answer.
(i) \({\chi ^2}{\text{ statistic}} = 10.3\;\;\;(10.3257 \ldots )\) (G2)
Note: Accept \(10\) as a correct 2 significant figure answer.
(ii) \(p\)-value \( = 0.00573\;\;\;(0.00572531 \ldots )\) (G1)
since \(p\)-value \( < 0.01,{\text{ }}{{\text{H}}_0}\) should not be accepted (R1)(A1)(ft)
OR
since \({\chi ^2}{\text{ statistic}} > {\chi ^2}{\text{ critical value}},{\text{ }}{{\text{H}}_0}\) should not be accepted (R1)(A1)(ft)
Note: Do not award (R0)(A1). Follow through from their answer to part (d). Award (R0)(A0) if part (d) is unanswered.
Award (R1) for a correct comparison of either their \(p\)-value to the test level or their \({\chi ^2}\) statistic to the \({\chi ^2}\) critical value, award (A1) for the correct result from that comparison.
Question
A group of 800 students answered 40 questions on a category of their choice out of History, Science and Literature.
For each student the category and the number of correct answers, \(N\), was recorded. The results obtained are represented in the following table.
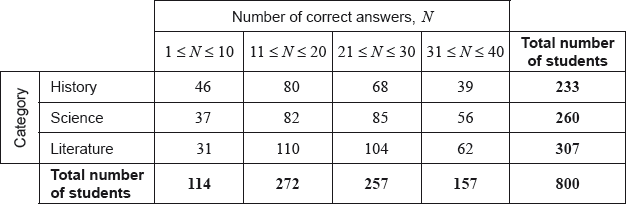
A \({\chi ^2}\) test at the 5% significance level is carried out on the results. The critical value for this test is 12.592.
State whether \(N\) is a discrete or a continuous variable.[1]
Write down, for \(N\), the modal class;[1]
Write down, for \(N\), the mid-interval value of the modal class.[1]
Use your graphic display calculator to estimate the mean of \(N\);[2]
Use your graphic display calculator to estimate the standard deviation of \(N\).[1]
Find the expected frequency of students choosing the Science category and obtaining 31 to 40 correct answers.[2]
Write down the null hypothesis for this test;[1]
Write down the number of degrees of freedom.[1]
Write down the \(p\)-value for the test;[1]
Write down the \({\chi ^2}\) statistic.[2]
State the result of the test. Give a reason for your answer.[2]
Answer/Explanation
Markscheme
discrete (A1)[1 mark]
\(11 \leqslant N \leqslant 20\) (A1)[1 mark]
15.5 (A1)(ft)
Note: Follow through from part (b)(i).[1 mark]
\(21.2{\text{ }}(21.2125)\) (G2)[2 marks]
\(9.60{\text{ }}(9.60428 \ldots )\) (G1)[1 marks]
\(\frac{{260}}{{800}} \times \frac{{157}}{{800}} \times 800\)\(\,\,\,\)OR\(\,\,\,\)\(\frac{{260 \times 157}}{{800}}\) (M1)
Note: Award (M1) for correct substitution into expected frequency formula.
\( = 51.0{\text{ }}(51.025)\) (A1)(G2)[2 marks]
choice of category and number of correct answers are independent (A1)
Notes: Accept “no association” between (choice of) category and number of correct answers. Do not accept “not related” or “not correlated” or “influenced”.[1 mark]
6 (A1)[1 mark]
\(0.0644{\text{ }}(0.0644123 \ldots )\) (G1)[1 mark]
\(11.9{\text{ }}(11.8924 \ldots )\) (G2)[2 marks]
the null hypothesis is not rejected (the null hypothesis is accepted) (A1)(ft)
OR
(choice of) category and number of correct answers are independent (A1)(ft)
as \(11.9 < 12.592\)\(\,\,\,\)OR\(\,\,\,\)\(0.0644 > 0.05\) (R1)
Notes: Award (R1) for a correct comparison of either their \({\chi ^2}\) statistic to the \({\chi ^2}\) critical value or their \(p\)-value to the significance level. Award (A1)(ft) from that comparison.
Follow through from part (f). Do not award (A1)(ft)(R0).[2 marks]
Question
On one day 180 flights arrived at a particular airport. The distance travelled and the arrival status for each incoming flight was recorded. The flight was then classified as on time, slightly delayed, or heavily delayed.
The results are shown in the following table.
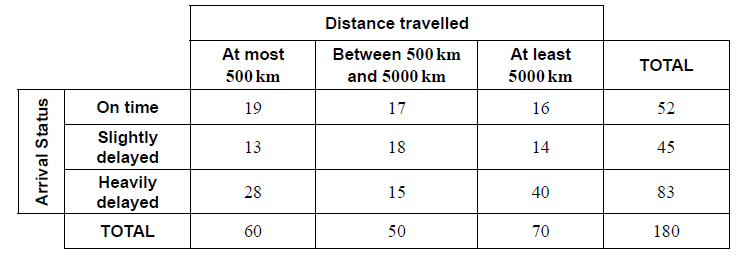
A χ2 test is carried out at the 10 % significance level to determine whether the arrival status of incoming flights is independent of the distance travelled.
The critical value for this test is 7.779.
A flight is chosen at random from the 180 recorded flights.
State the alternative hypothesis.[1]
Calculate the expected frequency of flights travelling at most 500 km and arriving slightly delayed.[2]
Write down the number of degrees of freedom.[1]
Write down the χ2 statistic.[2]
Write down the associated p-value.[1]
State, with a reason, whether you would reject the null hypothesis.[2]
Write down the probability that this flight arrived on time.[2]
Given that this flight was not heavily delayed, find the probability that it travelled between 500 km and 5000 km.[2]
Two flights are chosen at random from those which were slightly delayed.
Find the probability that each of these flights travelled at least 5000 km.[3]
Answer/Explanation
Markscheme
The arrival status is dependent on the distance travelled by the incoming flight (A1)
Note: Accept “associated” or “not independent”.[1 mark]
\(\frac{{60 \times 45}}{{180}}\) OR \(\frac{{60}}{{180}} \times \frac{{45}}{{180}} \times 180\) (M1)
Note: Award (M1) for correct substitution into expected value formula.
= 15 (A1) (G2)[2 marks]
4 (A1)
Note: Award (A0) if “2 + 2 = 4” is seen.[1 mark]
9.55 (9.54671…) (G2)
Note: Award (G1) for an answer of 9.54.[2 marks]
0.0488 (0.0487961…) (G1)[1 mark]
Reject the Null Hypothesis (A1)(ft)
Note: Follow through from their hypothesis in part (a).
9.55 (9.54671…) > 7.779 (R1)(ft)
OR
0.0488 (0.0487961…) < 0.1 (R1)(ft)
Note: Do not award (A1)(ft)(R0)(ft). Follow through from part (d). Award (R1)(ft) for a correct comparison, (A1)(ft) for a consistent conclusion with the answers to parts (a) and (d). Award (R1)(ft) for χ2calc > χ2crit , provided the calculated value is explicitly seen in part (d)(i)[2 marks]
\(\frac{{52}}{{180}}\,\,\left( {0.289,\,\,\frac{{13}}{{45}},\,\,28.9\,{\text{% }}} \right)\) (A1)(A1) (G2)
Note: Award (A1) for correct numerator, (A1) for correct denominator.[2 marks]
\(\frac{{35}}{{97}}\,\,\left( {0.361,\,\,36.1\,{\text{% }}} \right)\) (A1)(A1) (G2)
Note: Award (A1) for correct numerator, (A1) for correct denominator.[2 marks]
\(\frac{{14}}{{45}} \times \frac{{13}}{{44}}\) (A1)(M1)
Note: Award (A1) for two correct fractions and (M1) for multiplying their two fractions.
\( = \frac{{182}}{{1980}}\,\,\left( {0.0919,\,\,\frac{{91}}{{990}},\,0.091919 \ldots ,\,9.19\,{\text{% }}} \right)\) (A1) (G2)[3 marks]
Question
The weight, W, of basketball players in a tournament is found to be normally distributed with a mean of 65 kg and a standard deviation of 5 kg.
The probability that a basketball player has a weight that is within 1.5 standard deviations of the mean is q.
A basketball coach observed 60 of her players to determine whether their performance and their weight were independent of each other. Her observations were recorded as shown in the table.
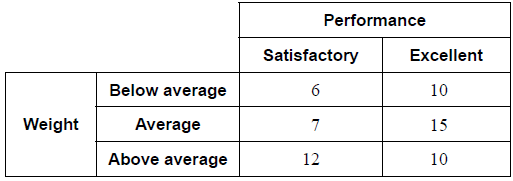
She decided to conduct a χ 2 test for independence at the 5% significance level.
Find the probability that a basketball player has a weight that is less than 61 kg.[2]
In a training session there are 40 basketball players.
Find the expected number of players with a weight less than 61 kg in this training session.[2]
Sketch a normal curve to represent this probability.[2]
Find the value of q.[1]
Given that P(W > k) = 0.225 , find the value of k.[2]
For this test state the null hypothesis.[1]
For this test find the p-value.[2]
State a conclusion for this test. Justify your answer.[2]
Answer/Explanation
Markscheme
P(W < 61) (M1)
Note: Award (M1) for correct probability statement.
OR
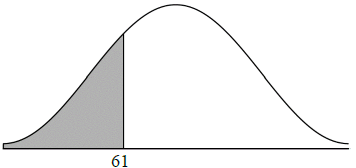 (M1)
(M1)
Note: Award (M1) for correct region labelled and shaded on diagram.
= 0.212 (0.21185…, 21.2%) (A1)(G2)[2 marks]
40 × 0.21185… (M1)
Note: Award (M1) for product of 40 and their 0.212.
= 8.47 (8.47421…) (A1)(ft)(G2)
Note: Follow through from their part (a)(i) provided their answer to part (a)(i) is less than 1.[2 marks]
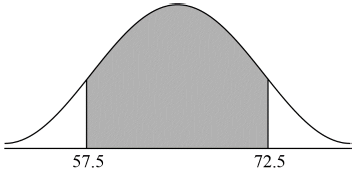 (A1)(M1)
Note: Award (A1) for two correctly labelled vertical lines in approximately correct positions. The values 57.5 and 72.5, or μ − 1.5σ and μ + 1.5σ are acceptable labels. Award (M1) for correctly shaded region marked by their two vertical lines.[2 marks]
0.866 (0.86638…, 86.6%) (A1)(ft)
Note: Follow through from their part (b)(i) shaded region if their values are clear.[1 mark]
P(W < k) = 0.775 (M1)
OR
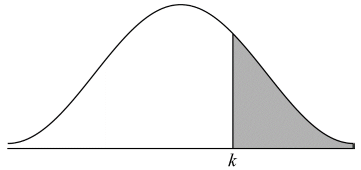 (M1)
(M1)
Note: Award (A1) for correct region labelled and shaded on diagram.
(k =) 68.8 (68.7770…) (A1)(G2)[2 marks]
(H0🙂 performance (of players) and (their) weight are independent. (A1)
Note: Accept “there is no association between performance (of players) and (their) weight”. Do not accept “not related” or “not correlated” or “not influenced”.[1 mark]
0.287 (0.287436…) (G2)[2 marks]
accept/ do not reject null hypothesis/H0 (A1)(ft)
OR
performance (of players) and (their) weight are independent. (A1)(ft)
0.287 > 0.05 (R1)(ft)
Note: Accept p-value>significance level provided their p-value is seen in b(ii). Accept 28.7% > 5%. Do not award (A1)(R0). Follow through from part (d).[2 marks]