Question
A scientist has 100 female fish and 100 male fish. She measures their lengths to the nearest cm. These are shown in the following box and whisker diagrams.
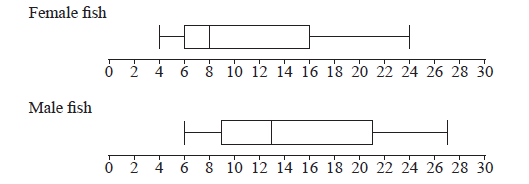
Find the range of the lengths of all 200 fish.
Four cumulative frequency graphs are shown below.
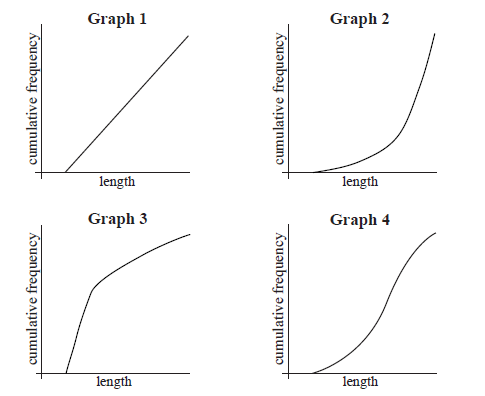
Which graph is the best representation of the lengths of the female fish?
Answer/Explanation
Markscheme
correct end points (A1)(A1)
max = 27 , min = 4
range = 23 A1 N3
[3 marks]
Graph 3 A2 N2
[2 marks]
Question
The weekly wages (in dollars) of 80 employees are displayed in the cumulative frequency curve below.
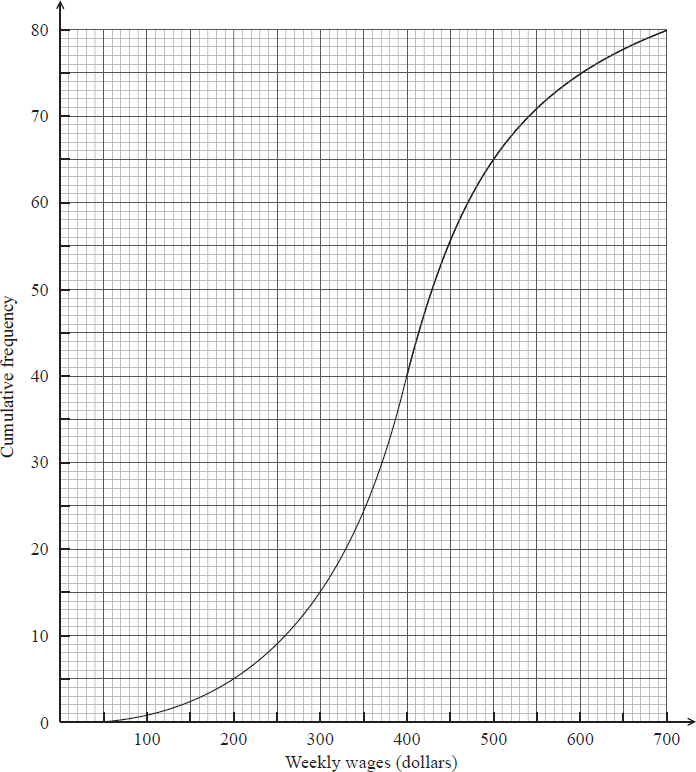
(i) Write down the median weekly wage.
(ii) Find the interquartile range of the weekly wages.
The box-and-whisker plot below displays the weekly wages of the employees.

Write down the value of
(i) \(a\) ;
(ii) \(b\) ;
(iii) \(c\) .
Employees are paid \($\ 20\) per hour.
Find the median number of hours worked per week.
Employees are paid \(\$ 20\) per hour.
Find the number of employees who work more than \(25\) hours per week.
Answer/Explanation
Markscheme
(i) median weekly wage \(= 400\) (dollars) A1 N1
(ii) lower quartile \(= 330\), upper quartile \(= 470\) (A1)(A1)
\({\text{IQR}} = 140\) (dollars) (accept any notation suggesting interval \(330\) to \(470\)) A1 N3
Note: Exception to the FT rule. Award A1(FT) for an incorrect IQR only if both quartiles are explicitly noted.
[4 marks]
(i) \(330\) (dollars) A1 N1
(ii) \(400\) (dollars) A1 N1
(iii) \(700\) (dollars) A1 N1
[3 marks]
valid approach (M1)
e.g. \({\rm{hours = }}\frac{{{\rm{wages}}}}{{{\rm{rate}}}}\)
correct substitution (A1)
e.g. \(\frac{{400}}{{20}}\)
median hours per week \(= 20\) A1 N2
[3 marks]
attempt to find wages for 25 hours per week (M1)
e.g. \({\text{wages}} = {\text{hours}} \times {\text{rate}}\)
correct substitution (A1)
e.g. \(25 \times 20\)
finding wages \(= 500\) (A1)
65 people (earn 500\( \leqslant \)) (A1)
15 people (work more than 25 hours) A1 N3
[5 marks]
Examiners report
Many candidates answered this question completely correctly, earning full marks in all parts of the question. In parts (a) and (b), there were some who gave the frequency values on the y-axis, rather than the wages on the x-axis, as their quartiles and interquartile range.
Many candidates answered this question completely correctly, earning full marks in all parts of the question. In parts (a) and (b), there were some who gave the frequency values on the y-axis, rather than the wages on the x-axis, as their quartiles and interquartile range.
For part (c), the majority of candidates seemed to understand what was required, though there were a few who used an extreme value such as \(700\), rather than the median value.
In part (d), some candidates simply answered \(65\), which is the number of workers earning \(\$ 500\) or less, rather than finding the number of workers who earned more than \(\$ 500\). It was interesting to note that quite a few candidates gave their final answer as \(14\), rather than \(15\).
Question
The following box-and-whisker plot shows the number of text messages sent by students in a school on a particular day.

Find the value of the interquartile range.
One student sent k text messages, where k > 11 . Given that k is an outlier, find the least value of k.
Answer/Explanation
Markscheme
recognizing Q1 or Q3 (seen anywhere) (M1)
eg 4,11 , indicated on diagram
IQR = 7 A1 N2
[2 marks]
recognizing the need to find 1.5 IQR (M1)
eg 1.5 × IQR, 1.5 × 7
valid approach to find k (M1)
eg 10.5 + 11, 1.5 × IQR + Q3
21.5 (A1)
k = 22 A1 N3
Note: If no working shown, award N2 for an answer of 21.5.
[4 marks]