Download IITian Academy App for accessing Online Mock Tests and More..

Question
In a school with 125 girls, each student is tested to see how many sit-up exercises (sit-ups) she can do in one minute. The results are given in the table below.
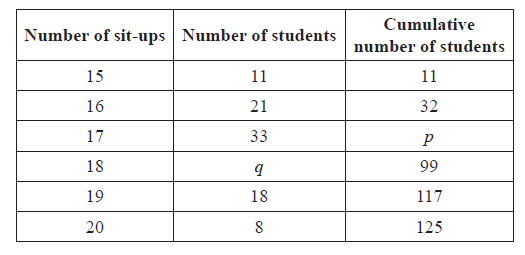
(i) Write down the value of p.
(ii) Find the value of q.
Find the median number of sit-ups.
Find the mean number of sit-ups.
Answer/Explanation
Markscheme
(i) \(p = 65\) A1 N1
(ii) for evidence of using sum is 125 (or \(99 – p\) ) (M1)
\(q = 34\) A1 N2
[3 marks]
evidence of median position (M1)
e.g. 63rd student, \(\frac{{125}}{2}\)
median is 17 (sit-ups) A1 N2
[2 marks]
evidence of substituting into \(\frac{{\sum {fx} }}{{125}}\) (M1)
e.g. \(\frac{{15(11) + 16(21) + 17(33) + 18(34) + 19(18) + 20(8)}}{{125}}\) , \(\frac{{2176}}{{125}}\)
mean \(= 17.4\) A1 N2
[2 marks]
Question
The following is a cumulative frequency diagram for the time t, in minutes, taken by 80 students to complete a task.
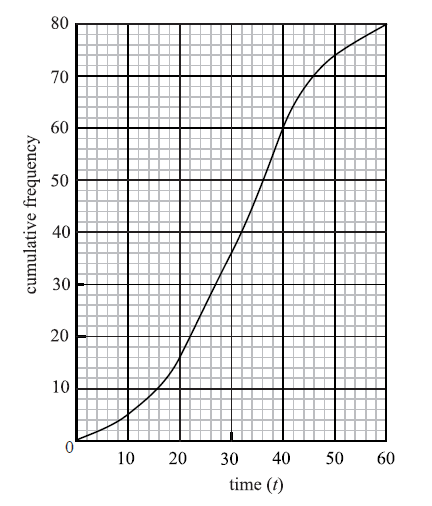
Write down the median.
Find the interquartile range.
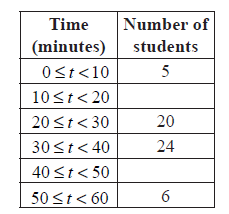
Complete the frequency table below.
Answer/Explanation
Markscheme
median \(m = 32\) A1 N1
[1 mark]
lower quartile \({Q_1} = 22\) , upper quartile \({Q_3} = 40\) (A1)(A1)
\({\text{interquartile range}} = 18\) A1 N3
[3 marks]
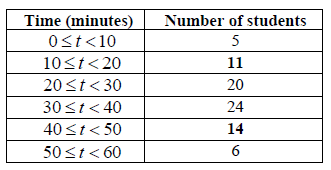 A1A1 N2
[2 marks]
Question
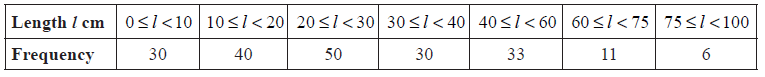
A fisherman catches 200 fish to sell. He measures the lengths, l cm of these fish, and the results are shown in the frequency table below.
Calculate an estimate for the standard deviation of the lengths of the fish.
A cumulative frequency diagram is given below for the lengths of the fish.
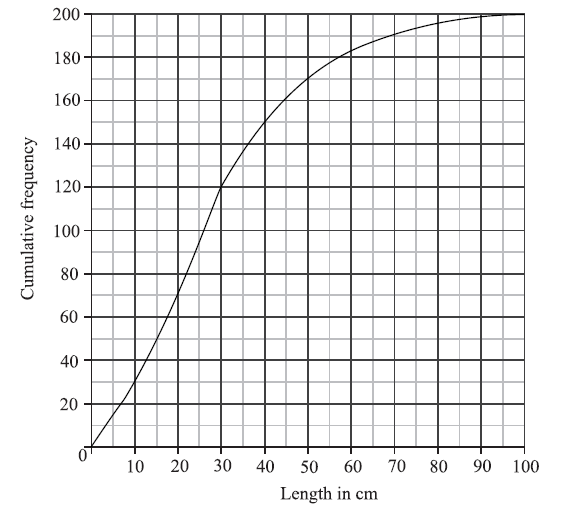
Use the graph to answer the following.
(i) Estimate the interquartile range.
(ii) Given that \(40\% \) of the fish have a length more than \(k{\text{ cm}}\), find the value of k.
In order to sell the fish, the fisherman classifies them as small, medium or large.
Small fish have a length less than \(20{\text{ cm}}\).
Medium fish have a length greater than or equal to \(20{\text{ cm}}\) but less than \(60{\text{ cm}}\).
Large fish have a length greater than or equal to \(60{\text{ cm}}\).
Write down the probability that a fish is small.
The cost of a small fish is \(\$ 4\), a medium fish \(\$ 10\), and a large fish \(\$ 12\).
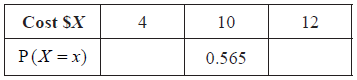
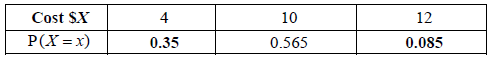
Copy and complete the following table, which gives a probability distribution for the cost \(\$ X\) .
Find \({\text{E}}(X)\) .
Answer/Explanation
Markscheme
evidence of using mid-interval values (5, 15, 25, 35, 50, 67.5, 87.5) (M1)
\(\sigma = 19.8\) (cm) A2 N3
[3 marks]
(i) \({Q_1} = 15\) , \({Q_3} = 40\) (A1)(A1)
\(IQR = 25\) (accept any notation that suggests the interval 15 to 40) A1 N3
(ii) METHOD 1
\(60\% \) have a length less than k (A1)
\(0.6 \times 200 = 120\) (A1)
\(k = 30\) (cm) A1 N2
METHOD 2
\(0.4 \times 200 = 80\) (A1)
\(200 – 80 = 120\) (A1)
\(k = 30\) (cm) A1 N2
[6 marks]
\(l < 20{\text{ cm}} \Rightarrow 70{\text{ fish}}\) (M1)
\({\rm{P(small)}} = \frac{{70}}{{200}}( = 0.35)\) A1 N2
[2 marks]
 A1A1 N2
[2 marks]
correct substitution (of their p values) into formula for \({\text{E}}(X)\) (A1)
e.g. \(4 \times 0.35 + 10 \times 0.565 + 12 \times 0.085\)
\({\text{E}}(X) = 8.07\) (accept \(\$ 8.07\)) A1 N2
[2 marks]
Question
The following frequency distribution of marks has mean 4.5.
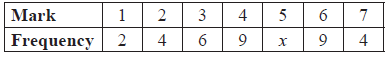
Find the value of x.
Write down the standard deviation.
Answer/Explanation
Markscheme
\(\sum {fx = 1(2) + 2(4) + \ldots + 7(4)} \) , \(\sum {fx = 146 + 5x} \) (seen anywhere) A1
evidence of substituting into mean \(\frac{{\sum {fx} }}{{\sum f }}\) (M1)
correct equation A1
e.g. \(\frac{{146 + 5x}}{{34 + x}} = 4.5\) , \(146 + 5x = 4.5(34 + x)\)
\(x = 14\) A1 N2
[4 marks]
\(\sigma = 1.54\) A2 N2
[2 marks]
Question
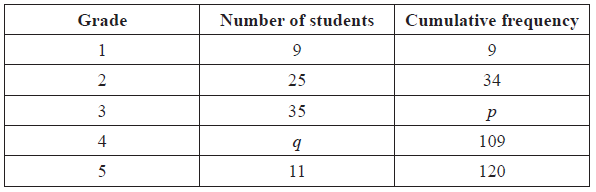
The following table gives the examination grades for 120 students.
Find the value of
(i) p ;
(ii) q .
Find the mean grade.
Write down the standard deviation.
Answer/Explanation
Markscheme
(a) (i) evidence of appropriate approach (M1)
e.g. \(9 + 25 + 35\) , \(34 + 35\)
\(p = 69\) A1 N2
(ii) evidence of valid approach (M1)
e.g. \(109 – \) their value of p, \(120 – (9 + 25 + 35 + 11)\)
\(q = 40\) A1 N2
[4 marks]
evidence of appropriate approach (M1)
e.g. substituting into \(\frac{{\sum {fx} }}{n}\), division by 120
mean \(= 3.16\) A1 N2
[2 marks]
1.09 A1 N1
[1 mark]
Question
A standard die is rolled 36 times. The results are shown in the following table.
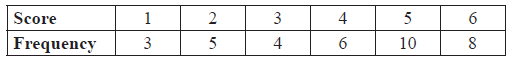
Write down the standard deviation.
Write down the median score.
Find the interquartile range.
Answer/Explanation
Markscheme
\(\sigma = 1.61\) A2 N2
[2 marks]
median \( = 4.5\) A1 N1
[1 mark]
\({Q_1} = 3\) , \({Q_3} = 5\) (may be seen in a box plot) (A1)(A1)
\({\text{IQR}} = 2\) (accept any notation that suggests the interval 3 to 5) A1 N3
[3 marks]
Question
The histogram below shows the time T seconds taken by 93 children to solve a puzzle.
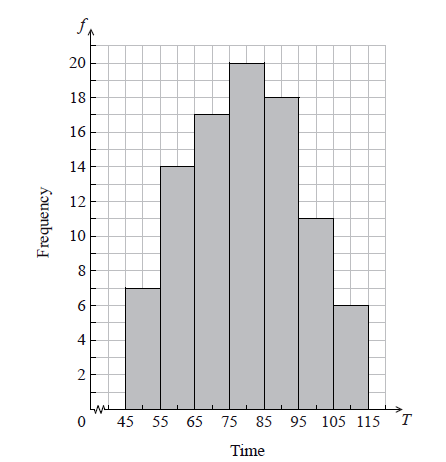
The following is the frequency distribution for T .
(i) Write down the value of p and of q .
(ii) Write down the median class.
A child is selected at random. Find the probability that the child takes less than 95 seconds to solve the puzzle.
Consider the class interval \(45 \le T < 55\) .
(i) Write down the interval width.
(ii) Write down the mid-interval value.
Hence find an estimate for the
(i) mean;
(ii) standard deviation.
John assumes that T is normally distributed and uses this to estimate the probability that a child takes less than 95 seconds to solve the puzzle.
Find John’s estimate.
Answer/Explanation
Answer/Explanation
Markscheme
(i) \(p = 17\) , \(q = 11\) A1A1 N2
(ii) \(75 \le T < 85\) A1 N1
[3 marks]
evidence of valid approach (M1)
e.g. adding frequencies
\(\frac{{76}}{{93}} = 0.8172043 \ldots \)
\({\rm{P}}(T < 95) = \frac{{76}}{{93}} = 0.817\) A1 N2
[2 marks]
(i) 10 A1 N1
(ii) 50 A1 N1
[2 marks]
(i) evidence of approach using mid-interval values (may be seen in part (ii)) (M1)
\(79.1397849\)
\(\overline x = 79.1\) A2 N3
(ii) \(16.4386061\)
\(\sigma = 16.4\) A1 N1
[4 marks]
e.g. standardizing, \(z = 0.9648 \ldots \)
\(0.8326812\)
\({\rm{P}}(T < 95) = 0.833\) A1 N2
[2 marks]
Question
Consider the following cumulative frequency table.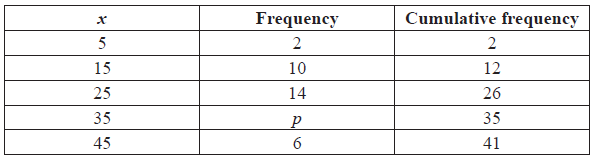
Find the value of \(p\) .
Find
(i) the mean;
(ii) the variance.
Answer/Explanation
Markscheme
valid approach (M1)
eg \(35 – 26\) , \(26 + p = 36\)
\(p = 9\) A1 N2
[2 marks]
(i) mean \( = 26.7\) A2 N2
(ii) recognizing that variance is (sd)2 (M1)
eg \(11.021{ \ldots ^2}\) , \(\sigma = \sqrt {{\mathop{\rm var}} } \) , \(11.158{ \ldots ^2}\)
\({\sigma ^2} = 121\) A1 N2
[4 marks]
Question
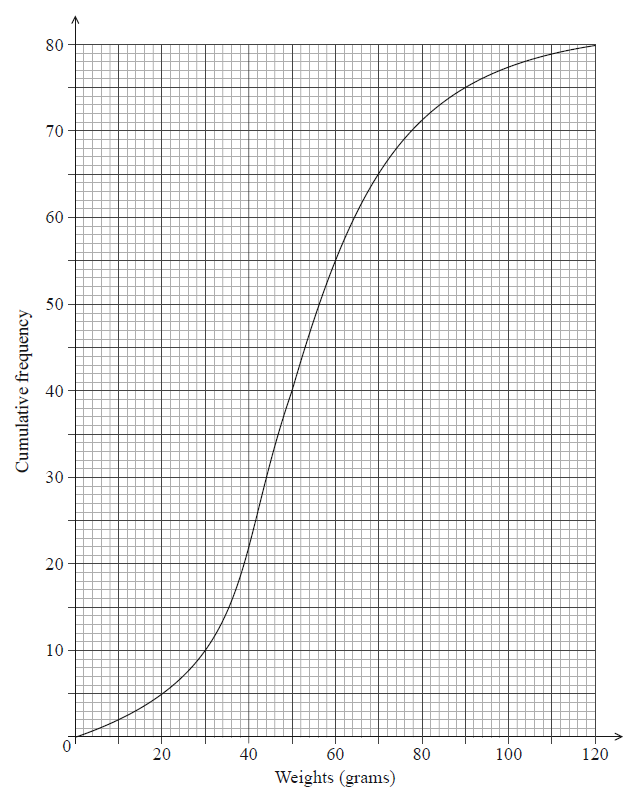
The weights in grams of 80 rats are shown in the following cumulative frequency diagram.
Do NOT write solutions on this page.
Write down the median weight of the rats.
Find the percentage of rats that weigh 70 grams or less.
The same data is presented in the following table.
| Weights \(w\) grams | \(0 \leqslant w \leqslant 30\) | \(30 < w \leqslant 60\) | \(60 < w \leqslant 90\) | \(90 < w \leqslant 120\) |
| Frequency | \(p\) | \(45\) | \(q\) | \(5\) |
Write down the value of \(p\).
The same data is presented in the following table.
| Weights \(w\) grams | \(0 \leqslant w \leqslant 30\) | \(30 < w \leqslant 60\) | \(60 < w \leqslant 90\) | \(90 < w \leqslant 120\) |
| Frequency | \(p\) | \(45\) | \(q\) | \(5\) |
Find the value of \(q\).
The same data is presented in the following table.
| Weights \(w\) grams | \(0 \leqslant w \leqslant 30\) | \(30 < w \leqslant 60\) | \(60 < w \leqslant 90\) | \(90 < w \leqslant 120\) |
| Frequency | \(p\) | \(45\) | \(q\) | \(5\) |
Use the values from the table to estimate the mean and standard deviation of the weights.
Assume that the weights of these rats are normally distributed with the mean and standard deviation estimated in part (c).
Find the percentage of rats that weigh 70 grams or less.
Assume that the weights of these rats are normally distributed with the mean and standard deviation estimated in part (c).
A sample of five rats is chosen at random. Find the probability that at most three rats weigh 70 grams or less.
Answer/Explanation
Markscheme
50 (g) A1 N1
[2 marks]
65 rats weigh less than 70 grams (A1)
attempt to find a percentage (M1)
eg \(\frac{{65}}{{80}},{\text{ }}\frac{{65}}{{80}} \times 100\)
81.25 (%) (exact), 81.3 A1 N3
[2 marks]
\(p = 10\) A2 N2
[2 marks]
subtracting to find \(q\) (M1)
eg \(75 – 45 – 10\)
\(q = 20\) A1 N2
[2 marks]
evidence of mid-interval values (M1)
eg \(15, 45, 75, 105\)
\(\overline x = 52.5\) (exact), \(\sigma = 22.5\) (exact) A1A1 N3
[3 marks]
0.781650
78.2 (%) A2 N2
[2 marks]
recognize binomial probability (M1)
eg \(X \sim {\text{B}}(n,{\text{ }}p)\), \(\left( \begin{array}{c}5\\r\end{array} \right)\) \( \times {0.782^r} \times {0.218^{5 – r}}\)
valid approach (M1)
eg \({\text{P}}(X \leqslant 3)\)
\(0.30067\)
\(0.301\) A1 N2
[3 marks]
Question
The following cumulative frequency graph shows the monthly income, \(I\) dollars, of \(2000\) families.
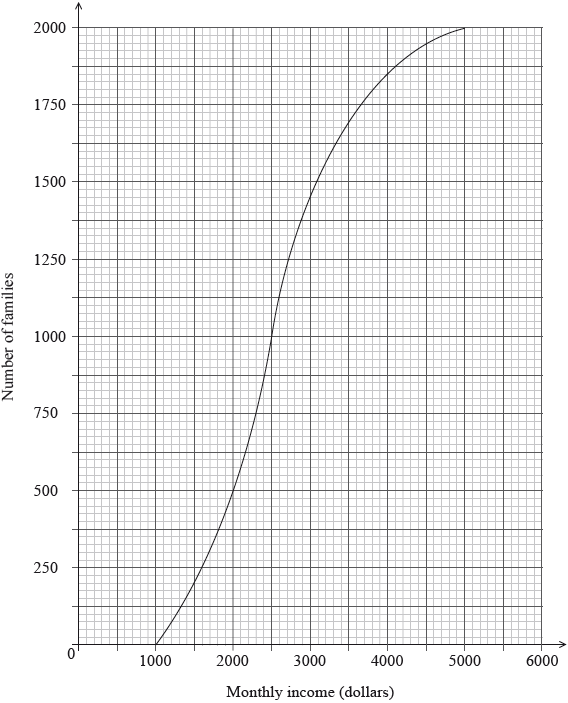
Find the median monthly income.
(i) Write down the number of families who have a monthly income of \(2000\) dollars or less.
(ii) Find the number of families who have a monthly income of more than \(4000\) dollars.
The \(2000\) families live in two different types of housing. The following table gives information about the number of families living in each type of housing and their monthly income \(I\).
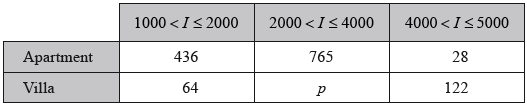
Find the value of \(p\).
A family is chosen at random.
(i) Find the probability that this family lives in an apartment.
(ii) Find the probability that this family lives in an apartment, given that its monthly income is greater than \(4000\) dollars.
Estimate the mean monthly income for families living in a villa.
Answer/Explanation
Markscheme
recognizing that the median is at half the total frequency (M1)
eg\(\;\;\;\)\(\frac{{2000}}{2}\)
\(m = 2500{\text{ (dollars)}}\) A1 N2
[2 marks]
(i) \(500\) families have a monthly income less than \(2000\) A1 N1
(ii) correct cumulative frequency, \(1850\) (A1)
subtracting their cumulative frequency from \(2000\) (M1)
eg\(\;\;\;\)\(2000 – 1850\)
\(150\) families have a monthly income of more than \(4000\) dollars A1 N2
Note: If working shown, award M1A1A1 for \(128{\rm{ }} + {\rm{ }}22{\rm{ }} = {\rm{ }}150\), using the table.
[4 marks]
correct calculation (A1)
eg\(\;\;\;\)\(2000 – (436 + 64 + 765 + 28 + 122),{\text{ }}1850 – 500 – 765\) (A1)
\(p = 585\) A1 N2
[2 marks]
(i) correct working (A1)
eg\(\;\;\;\)\(436 + 765 + 28\)
\(0.6145\;\;\;\)(exact) A1 N2
\(\frac{{1229}}{{2000}},{\text{ }}0.615{\text{ }}[0.614,{\text{ }}0.615]\)
(ii) correct working/probability for number of families (A1)
eg\(\;\;\;\)\(122 + 28,{\text{ }}\frac{{150}}{{2000}},{\text{ 0.075}}\)
\(0.186666\)
\(\frac{{28}}{{150}}\;\;\;\left( { = \frac{{14}}{{75}}} \right),{\text{ }}0.187{\text{ }}[0.186,{\text{ }}0.187]\) A1 N2
[4 marks]
evidence of using correct mid-interval values (\(1500,{\rm{ }}3000,{\rm{ }}4500\)) (A1)
attempt to substitute into \(\frac{{\sum {fx} }}{{\sum f }}\) (M1)
eg\(\;\;\;\)\(\frac{{1500 \times 64 + 3000 \times p + 4500 \times 122}}{{64 + 585 + 122}}\)
\(3112.84\)
\(3110{\text{ }}[3110,{\text{ }}3120]{\text{ (dollars)}}\) A1 N2
[3 marks]
Total [15 marks]