Question
A scientist has 100 female fish and 100 male fish. She measures their lengths to the nearest cm. These are shown in the following box and whisker diagrams.
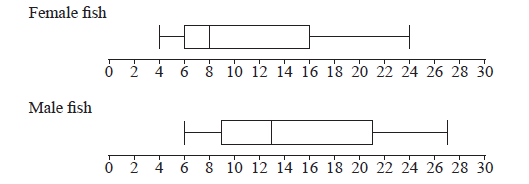
Find the range of the lengths of all 200 fish.
Four cumulative frequency graphs are shown below.
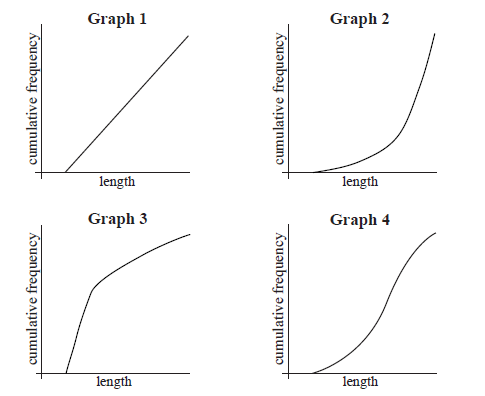
Which graph is the best representation of the lengths of the female fish?
Answer/Explanation
Markscheme
correct end points (A1)(A1)
max = 27 , min = 4
range = 23 A1 N3
[3 marks]
Graph 3 A2 N2
[2 marks]
Question
The ages of people attending a music concert are given in the table below.
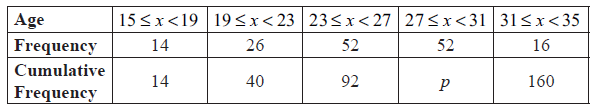
Find p .
The cumulative frequency diagram is given below.
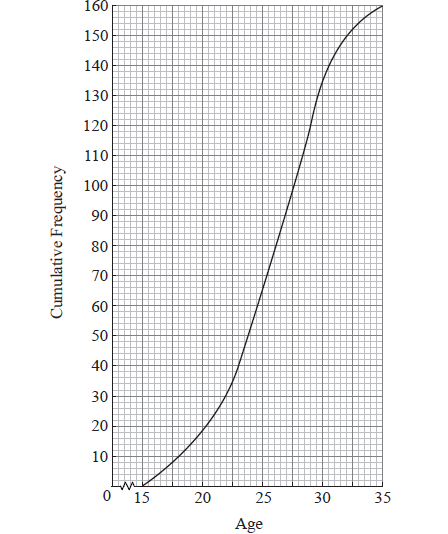
Use the diagram to estimate
(i) the 80th percentile;
(ii) the interquartile range.
Answer/Explanation
Markscheme
evidence of valid approach (M1)
e.g. \(92 + 52\) , line on graph at \(x = 31\)
\(p = 144\) A1 N2
[2 marks]
(i) evidence of valid approach (M1)
e.g. line on graph, \(0.8 \times 160\) , using complement
\( = 29.5\) A1 N2
(ii) \({Q_1} = 23\) ; \({Q_3} = 29\) (A1)(A1)
\({\text{IQR}} = 6\) (accept any notation that suggests an interval) A1 N3
[5 marks]
Question
The cumulative frequency curve below represents the marks obtained by 100 students.
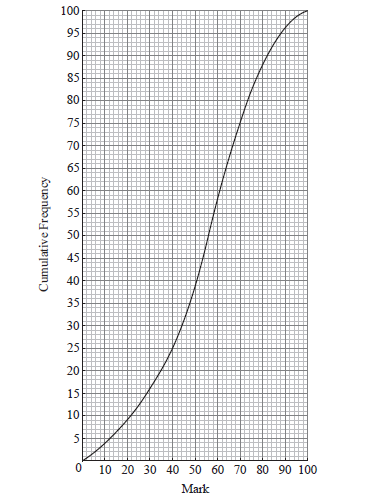
Find the median mark.
Find the interquartile range.
Answer/Explanation
Markscheme
evidence of median position (M1)
e.g. 50, line on sketch
median is 56 A1 N2
[2 marks]
lower quartile \(= 40\) , upper quartile \(= 70\) (A1)(A1)
interquartile range \(= 30\) A1 N3
[3 marks]
Question
The weekly wages (in dollars) of 80 employees are displayed in the cumulative frequency curve below.

(i) Write down the median weekly wage.
(ii) Find the interquartile range of the weekly wages.
The box-and-whisker plot below displays the weekly wages of the employees.

Write down the value of
(i) \(a\) ;
(ii) \(b\) ;
(iii) \(c\) .
Employees are paid \($\ 20\) per hour.
Find the median number of hours worked per week.
Employees are paid \(\$ 20\) per hour.
Find the number of employees who work more than \(25\) hours per week.
Answer/Explanation
Markscheme
(i) median weekly wage \(= 400\) (dollars) A1 N1
(ii) lower quartile \(= 330\), upper quartile \(= 470\) (A1)(A1)
\({\text{IQR}} = 140\) (dollars) (accept any notation suggesting interval \(330\) to \(470\)) A1 N3
Note: Exception to the FT rule. Award A1(FT) for an incorrect IQR only if both quartiles are explicitly noted.
[4 marks]
(i) \(330\) (dollars) A1 N1
(ii) \(400\) (dollars) A1 N1
(iii) \(700\) (dollars) A1 N1
[3 marks]
valid approach (M1)
e.g. \({\rm{hours = }}\frac{{{\rm{wages}}}}{{{\rm{rate}}}}\)
correct substitution (A1)
e.g. \(\frac{{400}}{{20}}\)
median hours per week \(= 20\) A1 N2
[3 marks]
attempt to find wages for 25 hours per week (M1)
e.g. \({\text{wages}} = {\text{hours}} \times {\text{rate}}\)
correct substitution (A1)
e.g. \(25 \times 20\)
finding wages \(= 500\) (A1)
65 people (earn 500\( \leqslant \)) (A1)
15 people (work more than 25 hours) A1 N3
[5 marks]
Question
A running club organizes a race to select girls to represent the club in a competition.
The times taken by the group of girls to complete the race are shown in the table below.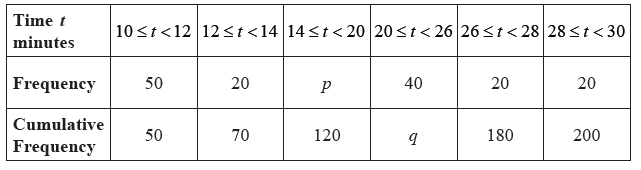
Find the value of \(p\) and of \(q\) .
A girl is chosen at random.
(i) Find the probability that the time she takes is less than \(14\) minutes.
(ii) Find the probability that the time she takes is at least \(26\) minutes.
A girl is selected for the competition if she takes less than \(x\) minutes to complete the race.
Given that \(40\%\) of the girls are not selected,
(i) find the number of girls who are not selected;
(ii) find \(x\) .
Girls who are not selected, but took less than \(25\) minutes to complete the race, are allowed another chance to be selected. The new times taken by these girls are shown in the cumulative frequency diagram below.
(i) Write down the number of girls who were allowed another chance.
(ii) Find the percentage of the whole group who were selected.
Answer/Explanation
Markscheme
attempt to find \(p\) (M1)
eg \(120 – 70\) , \(50 + 20 + x = 120\)
\(p = 50\) A1 N2
attempt to find \(q\) (M1)
eg \(180 – 20\) , \(200 – 20 – 20\)
\(q = 160\) A1 N2
[4 marks]
(i) \(\frac{{70}}{{200}}\) \(\left( { = \frac{7}{{20}}} \right)\) A1 N1
(ii) valid approach (M1)
eg \(20 + 20\) , \(200 – 160\)
\(\frac{{40}}{{200}}\) \(\left( { = \frac{1}{5}} \right)\) A1 N2
[3 marks]
(i) attempt to find number of girls (M1)
eg \(0.4\), \(\frac{{40}}{{100}} \times 200\)
\(80\) are not selected A1 N2
(ii) \(120\) are selected (A1)
\(x = 20\) A1 N2
[4 marks]
(i) \(30\) given second chance A1 N1
(ii) \(20\) took less than \(20\) minutes (A1)
attempt to find their selected total (may be seen in \(\%\) calculation) (M1)
eg \(120 + 20\) \(( = 140)\) , \(120 + \) their answer from (i)
\(70\) (\(\%\)) A1 N3
[4 marks]
Question
The following is a cumulative frequency diagram for the time t, in minutes, taken by 80 students to complete a task.
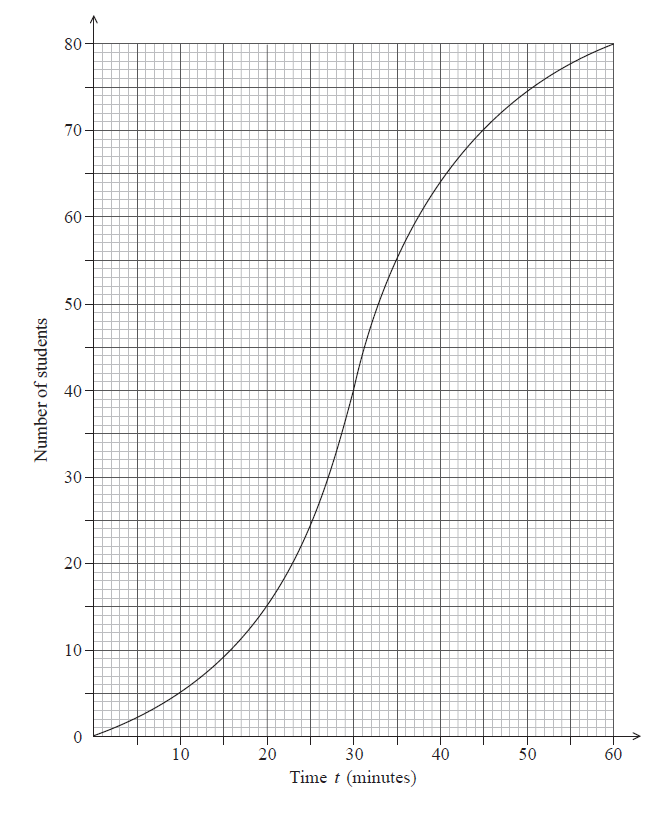
Find the number of students who completed the task in less than 45 minutes.
Find the number of students who took between 35 and 45 minutes to complete the task.
Given that 50 students take less than k minutes to complete the task, find the value of \(k\).
Answer/Explanation
Markscheme
attempt to find number who took less than 45 minutes (M1)
eg line on graph (vertical at approx 45, or horizontal at approx 70)
70 students (accept 69) A1 N2
[2 marks]
55 students completed task in less than 35 minutes (A1)
subtracting their values (M1)
eg 70 – 55
15 students A1 N2
[3 marks]
correct approach (A1)
eg line from y-axis on 50
\(k = 33\) A1 N2
[2 marks]
Question
A school collects cans for recycling to raise money. Sam’s class has 20 students.
The number of cans collected by each student in Sam’s class is shown in the following stem and leaf diagram.
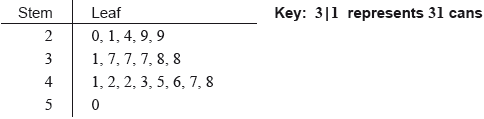
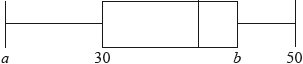
The following box-and-whisker plot also displays the number of cans collected by students in Sam’s class.
There are 80 students in the school.
The mean number of cans collected is 39.4. The standard deviation is 18.5.
Each student then collects 2 more cans.
Find the median number of cans collected.
(i) Write down the value of \(a\).
(ii) The interquartile range is 14. Find the value of \(b\).
Sam’s class collected 745 cans. They want an average of 40 cans per student.
How many more cans need to be collected to achieve this target?
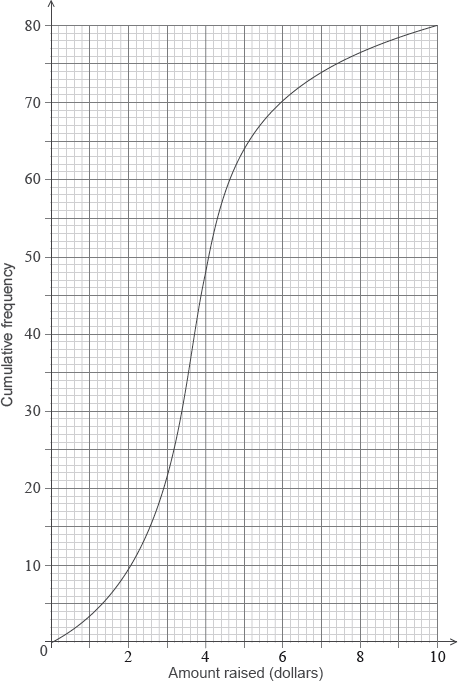
The students raise $0.10 for each recycled can.
(i) Find the largest amount raised by a student in Sam’s class.
(ii) The following cumulative frequency curve shows the amounts in dollars raised by all the students in the school. Find the percentage of students in the school who raised more money than anyone in Sam’s class.

(i) Write down the new mean.
(ii) Write down the new standard deviation.
Answer/Explanation
Markscheme
valid approach (M1)
eg\(\,\,\,\,\,\)between 10th and 11th, \(\frac{{8 + 8}}{2}\)
median \( = 38\) A1 N2
[2 marks]
(i) \(a = 20\) A1 N1
(ii) valid approach (M1)
eg\(\,\,\,\,\,\)\({Q_3} – {Q_1},{\text{ }}{Q_1} + 14,{\text{ }}b – 30 = 14\)
\(b = 44\) A1 N2
[3 marks]
valid approach (M1)
egx\(\,\,\,\,\,\)\(40 \times 20,{\text{ }}\frac{{x + 745}}{{20}},{\text{ }}40 – \frac{{745}}{{20}}\)
correct working (A1)
eg\(\,\,\,\,\,\)\(800 – 745,{\text{ }}20 \times 2.75\)
55 (more cans) A1 N2
[3 marks]
(i) most cans in Sam’s class \( = 50\) (A1)
5 ($) A1 N2
(ii) correct value of 64 or 16 A1
valid approach (M1)
eg\(\,\,\,\,\,\)\(\frac{{64}}{{80}},{\text{ }}80\% ,{\text{ }}80 – 64,{\text{ }}\frac{{16}}{{80}}\)
20% A1 N2
[5 marks]
(i) 41.4 (exact) A1 N1
(ii) 18.5 A1 N1
[2 marks]