Download IITian Academy App for accessing Online Mock Tests and More..

Question
The following table shows the Diploma score \(x\) and university entrance mark \(y\) for seven IB Diploma students.
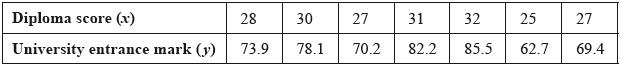
Find the correlation coefficient.
The relationship can be modelled by the regression line with equation \(y = ax + b\).
Write down the value of \(a\) and of \(b\).
Rita scored a total of \(26\) in her IB Diploma.
Use your regression line to estimate Rita’s university entrance mark.
Answer/Explanation
Markscheme
evidence of set up (M1)
eg\(\;\;\;\)correct value for \(r\) (or for \(a\) or \(r\), seen in (b))
\(0.996010\)
\(r = 0.996\;\;\;[0.996,{\text{ }}0.997]\) A1 N2
[2 marks]
\(a = 3.15037,{\text{ }}b = – 15.4393\)
\(a = 3.15{\text{ }}[3.15,{\text{ }}3.16],{\text{ }}b = – 15.4{\text{ }}[ – 15.5,{\text{ }} – 15.4]\) A1A1 N2
[2 marks]
substituting \(26\) into their equation (M1)
eg\(\;\;\;\)\(y = 3.15(26) – 15.4\)
\(66.4704\)
\(66.5{\text{ }}[66.4,{\text{ }}66.5]\) A1 N2
[2 marks]
Total [6 marks]
Question
The following table shows the average number of hours per day spent watching television by seven mothers and each mother’s youngest child.
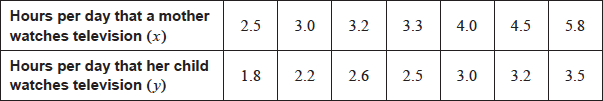
The relationship can be modelled by the regression line with equation \(y = ax + b\).
(i) Find the correlation coefficient.
(ii) Write down the value of \(a\) and of \(b\).
Elizabeth watches television for an average of \(3.7\) hours per day.
Use your regression line to predict the average number of hours of television watched per day by Elizabeth’s youngest child. Give your answer correct to one decimal place.
Answer/Explanation
Markscheme
(i) evidence of valid approach (M1)
eg\(\;\;\;\)\(1\) correct value for \(r\), (or for \(a\) or \(b\), seen in (ii))
\(0.946591\)
\(r = 0.947\) A1 N2
(ii) \(a = 0.500957,{\text{ }}b = 0.803544\)
\(a = 0.501,{\text{ }}b = 0.804\) A1A1 N2
[4 marks]
substituting \(x = 3.7\) into their equation (M1)
eg\(\;\;\;0.501(3.7) + 0.804\)
\(2.65708\;\;\;\)(\(2\) hours \(39.4252\) minutes) (A1)
\(y = 2.7\) (hours) (must be correct \(1\) dp, accept \(2\) hours \(39.4\) minutes) A1 N3
[3 marks]
Total [7 marks]
Question
The following table shows the sales, \(y\) millions of dollars, of a company, \(x\) years after it opened.
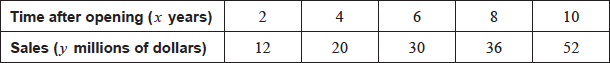
The relationship between the variables is modelled by the regression line with equation \(y = ax + b\).
(i) Find the value of \(a\) and of \(b\).
(ii) Write down the value of \(r\).
Hence estimate the sales in millions of dollars after seven years.
Answer/Explanation
Markscheme
(i) evidence of set up (M1)
eg\(\;\;\;\)correct value for \(a\), \(b\) or \(r\)
\(a = 4.8,{\text{ }}b = 1.2\) A1A1 N3
(ii) \(r = 0.988064\)
\(r = 0.988\) A1 N1
[4 marks]
correct substitution into their regression equation (A1)
eg\(\;\;\;4.8 \times 7 + 1.2\)
\(34.8\) (millions of dollars) (accept \(35\) and \({\text{34}}\,{\text{800}}\,{\text{000}}\)) A1 N2
[2 marks]
Total [6 marks]
Question
The price of a used car depends partly on the distance it has travelled. The following table shows the distance and the price for seven cars on 1 January 2010.
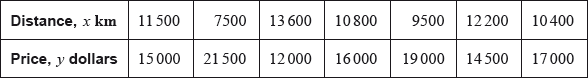
The relationship between \(x\) and \(y\) can be modelled by the regression equation \(y = ax + b\).
On 1 January 2010, Lina buys a car which has travelled \(11\,000{\text{ km}}\).
The price of a car decreases by 5% each year.
Lina will sell her car when its price reaches \(10\,000\) dollars.
(i) Find the correlation coefficient.
(ii) Write down the value of \(a\) and of \(b\).
Use the regression equation to estimate the price of Lina’s car, giving your answer to the nearest 100 dollars.
Calculate the price of Lina’s car after 6 years.
Find the year when Lina sells her car.
Answer/Explanation
Markscheme
Note: There may be slight differences in answers, depending on which values candidates carry through in subsequent parts. Accept answers that are consistent with their working.
(i) valid approach (M1)
eg\(\,\,\,\,\,\)correct value for \(r\) (or for \(a\) or \(b\) seen in (ii))
\( – 0.994347\)
\(r = – 0.994\) A1 N2
(ii) \( – 1.58095,{\text{ }}33480.3\)
\(a = – 1.58,{\text{ }}b = 33500\) A1A1 N2
[4 marks]
Note: There may be slight differences in answers, depending on which values candidates carry through in subsequent parts. Accept answers that are consistent with their working.
correct substitution into their regression equation
eg\(\,\,\,\,\,\)\( – 1.58095(11000){\text{ }} + 33480.3\) (A1)
\(16\,089.85{\text{ }}(16\,120{\text{ from 3sf}})\) (A1)
\({\text{price}} = 16\,100{\text{ }}({\text{dollars}})\) (must be rounded to the nearest 100 dollars) A1 N3
[3 marks]
Note: There may be slight differences in answers, depending on which values candidates carry through in subsequent parts. Accept answers that are consistent with their working.
METHOD 1
valid approach (M1)
eg\(\,\,\,\,\,\)\(P \times {({\text{rate}})^t}\)
\({\text{rate}} = 0.95\) (may be seen in their expression) (A1)
correct expression (A1)
eg\(\,\,\,\,\,\)\(16100 \times {0.95^6}\)
\(11\,834.97\)
\(11\,800{\text{ }}({\text{dollars}})\) A1 N2
METHOD 2
attempt to find all six terms (M1)
eg\(\,\,\,\,\,\)\(\left( {\left( {(16\,100 \times 0.95) \times 0.95} \right) \ldots } \right) \times 0.95\), table of values
5 correct values (accept values that round correctly to the nearest dollar)
\(15\,295,{\text{ }}14\,530,{\text{ }}13\,804,{\text{ }}13\,114,{\text{ }}12\,458\) A2
\(11\,835\)
\(11\,800{\text{ }}({\text{dollars}})\) A1 N2
[4 marks]
Note: There may be slight differences in answers, depending on which values candidates carry through in subsequent parts. Accept answers that are consistent with their working.
METHOD 1
correct equation (A1)
eg\(\,\,\,\,\,\)\(16\,100 \times {0.95^x}{\text{ = }}10\,000\)
valid attempt to solve (M1)
eg\(\,\,\,\,\,\) , using logs
9.28453 (A1)
year 2019 A1 N2
METHOD 2
valid approach using table of values (M1)
both crossover values (accept values that round correctly to the nearest dollar) A2
eg\(\,\,\,\,\,\)\({\text{P}} = 10\,147{\text{ }}({\text{1 Jan 2019}}),{\text{ P}} = 9\,639.7{\text{ }}({\text{1 Jan 2020}})\)
year 2019 A1 N2
[4 marks]
Question
The following table shows values of ln x and ln y.

The relationship between ln x and ln y can be modelled by the regression equation ln y = a ln x + b.
Find the value of a and of b.
Use the regression equation to estimate the value of y when x = 3.57.
The relationship between x and y can be modelled using the formula y = kxn, where k ≠ 0 , n ≠ 0 , n ≠ 1.
By expressing ln y in terms of ln x, find the value of n and of k.
Answer/Explanation
Markscheme
valid approach (M1)
eg one correct value
−0.453620, 6.14210
a = −0.454, b = 6.14 A1A1 N3
[3 marks]
correct substitution (A1)
eg −0.454 ln 3.57 + 6.14
correct working (A1)
eg ln y = 5.56484
261.083 (260.409 from 3 sf)
y = 261, (y = 260 from 3sf) A1 N3
Note: If no working shown, award N1 for 5.56484.
If no working shown, award N2 for ln y = 5.56484.
[3 marks]
METHOD 1
valid approach for expressing ln y in terms of ln x (M1)
eg \({\text{ln}}\,y = {\text{ln}}\,\left( {k{x^n}} \right),\,\,{\text{ln}}\,\left( {k{x^n}} \right) = a\,{\text{ln}}\,x + b\)
correct application of addition rule for logs (A1)
eg \({\text{ln}}\,k + {\text{ln}}\,\left( {{x^n}} \right)\)
correct application of exponent rule for logs A1
eg \({\text{ln}}\,k + n\,{\text{ln}}\,x\)
comparing one term with regression equation (check FT) (M1)
eg \(n = a,\,\,b = {\text{ln}}\,k\)
correct working for k (A1)
eg \({\text{ln}}\,k = 6.14210,\,\,\,k = {e^{6.14210}}\)
465.030
\(n = – 0.454,\,\,k = 465\) (464 from 3sf) A1A1 N2N2
METHOD 2
valid approach (M1)
eg \({e^{{\text{ln}}\,y}} = {e^{a\,{\text{ln}}\,x + b}}\)
correct use of exponent laws for \({e^{a\,{\text{ln}}\,x + b}}\) (A1)
eg \({e^{a\,{\text{ln}}\,x}} \times {e^b}\)
correct application of exponent rule for \(a\,{\text{ln}}\,x\) (A1)
eg \({\text{ln}}\,{x^a}\)
correct equation in y A1
eg \(y = {x^a} \times {e^b}\)
comparing one term with equation of model (check FT) (M1)
eg \(k = {e^b},\,\,n = a\)
465.030
\(n = – 0.454,\,\,k = 465\) (464 from 3sf) A1A1 N2N2
METHOD 3
valid approach for expressing ln y in terms of ln x (seen anywhere) (M1)
eg \({\text{ln}}\,y = {\text{ln}}\,\left( {k{x^n}} \right),\,\,{\text{ln}}\,\left( {k{x^n}} \right) = a\,{\text{ln}}\,x + b\)
correct application of exponent rule for logs (seen anywhere) (A1)
eg \({\text{ln}}\,\left( {{x^a}} \right) + b\)
correct working for b (seen anywhere) (A1)
eg \(b = {\text{ln}}\,\left( {{e^b}} \right)\)
correct application of addition rule for logs A1
eg \({\text{ln}}\,\left( {{e^b}{x^a}} \right)\)
comparing one term with equation of model (check FT) (M1)
eg \(k = {e^b},\,\,n = a\)
465.030
\(n = – 0.454,\,\,k = 465\) (464 from 3sf) A1A1 N2N2
[7 marks]
Question
The following table shows the mean weight, y kg , of children who are x years old.

The relationship between the variables is modelled by the regression line with equation \(y = ax + b\).
Find the value of a and of b.
Write down the correlation coefficient.
Use your equation to estimate the mean weight of a child that is 1.95 years old.
Answer/Explanation
Markscheme
valid approach (M1)
eg correct value for a or b (or for r seen in (ii))
a = 1.91966 b = 7.97717
a = 1.92, b = 7.98 A1A1 N3
[3 marks]
0.984674
r = 0.985 A1 N1
[1 mark]
correct substitution into their equation (A1)
eg 1.92 × 1.95 + 7.98
11.7205
11.7 (kg) A1 N2
[2 marks]
Question
There are nine books on a shelf. For each book, x is the number of pages, and y is the selling price in pounds (£). Let r be the correlation coefficient.
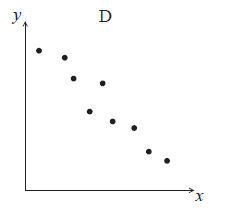
Write down the possible minimum and maximum values of r .
Given that \(r = 0.95\) , which of the following diagrams best represents the data.
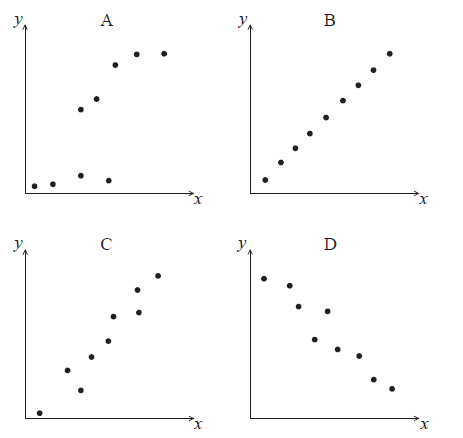
For the data in diagram D , which two of the following expressions describe the correlation between x and y ?
perfect, zero, linear, strong positive, strong negative, weak positive, weak negative
Answer/Explanation
Markscheme
min value of r is \( – 1\), max value of r is 1 A1A1 N2
[2 marks]
C A1 N1
[1 mark]
linear, strong negative A1A1 N2
[2 marks]