Question
The following diagram shows the graphs of the displacement, velocity and acceleration of a moving object as functions of time, t.
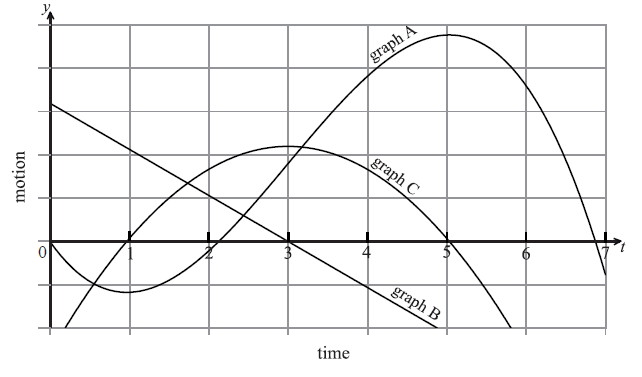
Complete the following table by noting which graph A, B or C corresponds to each function.
Write down the value of t when the velocity is greatest.
Answer/Explanation
Markscheme
 A2A2 N4
[4 marks]
\(t = 3\) A2 N2
[2 marks]
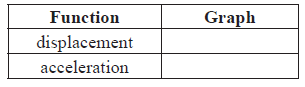
Question
A function f is defined for \( – 4 \le x \le 3\) . The graph of f is given below.
The graph has a local maximum when \(x = 0\) , and local minima when \(x = – 3\) , \(x = 2\) .
Write down the x-intercepts of the graph of the derivative function, \(f’\) .
Write down all values of x for which \(f'(x)\) is positive.
At point D on the graph of f , the x-coordinate is \( – 0.5\). Explain why \(f”(x) < 0\) at D.
Answer/Explanation
Markscheme
x-intercepts at \( – 3\), 0, 2 A2 N2
[2 marks]
\( – 3 < x < 0\) , \(2 < x < 3\) A1A1 N2
[2 marks]
correct reasoning R2
e.g. the graph of f is concave-down (accept convex), the first derivative is decreasing
therefore the second derivative is negative AG
[2 marks]
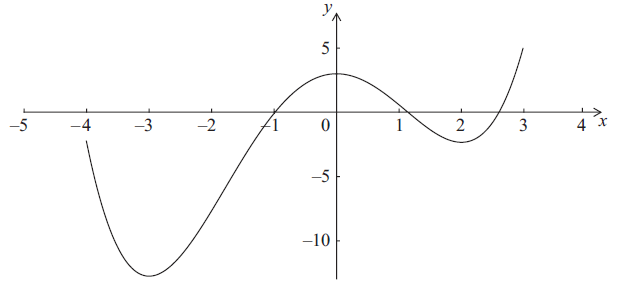
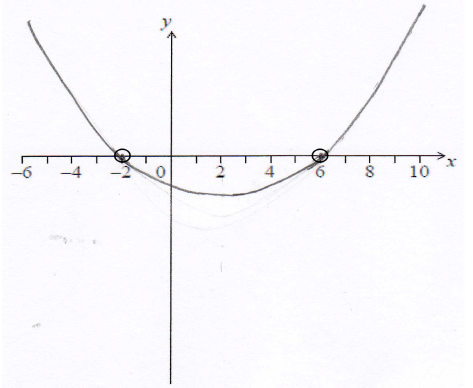
Question
The following diagram shows part of the graph of \(y = f(x)\).
The graph has a local maximum at \(A\), where \(x = – 2\), and a local minimum at \(B\), where \(x = 6\).
On the following axes, sketch the graph of \(y = f'(x)\).
Write down the following in order from least to greatest: \(f(0),{\text{ }}f'(6),{\text{ }}f”( – 2)\).
Answer/Explanation
Markscheme
 A1A1A1A1 N4
Note: Award A1 for x-intercept in circle at \(-2\), A1 for x-intercept in circle at \(6\).
Award A1 for approximately correct shape.
Only if this A1 is awarded, award A1 for a negative y-intercept.
[4 marks]
\(f”( – 2),{\text{ }}f'(6),{\text{ }}f(0)\) A2 N2
[2 marks]