Question
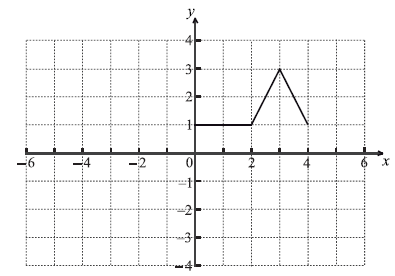
Consider the graph of \(f\) shown below.

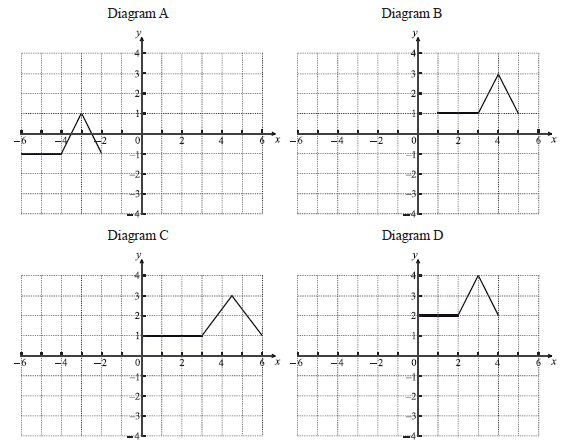
The following four diagrams show images of f under different transformations.

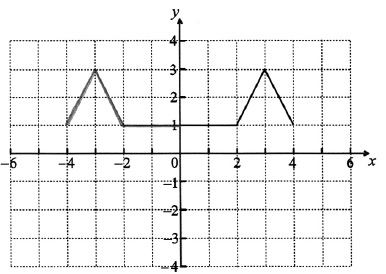
On the same grid sketch the graph of \(y = f( – x)\) .
Complete the following table.

Give a full geometric description of the transformation that gives the image in Diagram A.
Answer/Explanation
Markscheme
 A2 N2
A2 N2
[2 marks]
 A1A1 N2
[2 marks]
translation (accept move/shift/slide etc.) with vector \(\left( {\begin{array}{*{20}{c}}
{ – 6}\\
{ – 2}
\end{array}} \right)\) A1A1 N2
[2 marks]
Question
Let \(f(x) = 3{x^2}\) . The graph of f is translated 1 unit to the right and 2 units down. The graph of g is the image of the graph of f after this translation.
Write down the coordinates of the vertex of the graph of g .
Express g in the form \(g(x) = 3{(x – p)^2} + q\) .
The graph of h is the reflection of the graph of g in the x-axis.
Write down the coordinates of the vertex of the graph of h .
Answer/Explanation
Markscheme
\((1{\text{, }} – 2)\) A1A1 N2
[2 marks]
\(g(x) = 3{(x – 1)^2} – 2\) (accept \(p = 1\) , \(q = – 2\) ) A1A1 N2
[2 marks]
\((1{\text{, }}2)\) A1A1 N2
[2 marks]
Question
Let \(f\) and \(g\) be functions such that \(g(x) = 2f(x + 1) + 5\) .
(a) The graph of \(f\) is mapped to the graph of \(g\) under the following transformations:
vertical stretch by a factor of \(k\) , followed by a translation \(\left( \begin{array}{l}
p\\
q
\end{array} \right)\) .
Write down the value of
(i) \(k\) ;
(ii) \(p\) ;
(iii) \(q\) .
(b) Let \(h(x) = – g(3x)\) . The point A(\(6\), \(5\)) on the graph of \(g\) is mapped to the point \({\rm{A}}’\) on the graph of \(h\) . Find \({\rm{A}}’\) .
The graph of \(f\) is mapped to the graph of \(g\) under the following transformations:
vertical stretch by a factor of \(k\) , followed by a translation \(\left( \begin{array}{l}
p\\
q
\end{array} \right)\) .
Write down the value of
(i) \(k\) ;
(ii) \(p\) ;
(iii) \(q\) .
Let \(h(x) = – g(3x)\) . The point A(\(6\), \(5\)) on the graph of \(g\) is mapped to the point \({\rm{A}}’\) on the graph of \(h\) . Find \({\rm{A}}’\) .
Answer/Explanation
Markscheme
(a) (i) \(k = 2\) A1 N1
(ii) \(p = – 1\) A1 N1
(iii) \(q = 5\) A1 N1
[3 marks]
(b) recognizing one transformation (M1)
eg horizontal stretch by \(\frac{1}{3}\) , reflection in \(x\)-axis
\({\rm{A’}}\) is (\(2\), \( – 5\)) A1A1 N3
[3 marks]
Total [6 marks]
(i) \(k = 2\) A1 N1
(ii) \(p = – 1\) A1 N1
(iii) \(q = 5\) A1 N1
[3 marks]
recognizing one transformation (M1)
eg horizontal stretch by \(\frac{1}{3}\) , reflection in \(x\)-axis
\({\rm{A’}}\) is (\(2\), \( – 5\)) A1A1 N3
[3 marks]
Total [6 marks]
