
▶️ Answer/Explanation
Markscheme
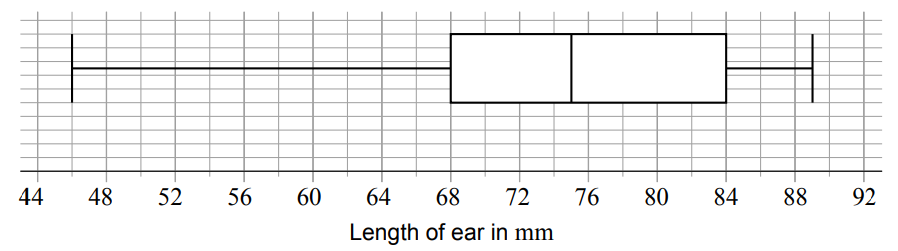
a) From the box plot, Spanish median is 75 mm, Q1 is 68 mm, Q3 is 84 mm. IQR is \( 84 – 68 = 16 \) mm.
| Australia | Spain | |
| Median (mm) | 80 | 75 |
| Interquartile Range (mm) | 11 | 16 |
bi) Australian median is 80 mm, Spanish is 75 mm. Since 80 > 75, Australian rabbits have longer ears on average. [1]
bii) Australian IQR is 11 mm, Spanish is 16 mm. Since 16 > 11, Spanish rabbits show more variation in ear lengths. [2]