▶️ Answer / Explanation
(a) \(T\) is a continuous variable (time). [1]
(b) Total frequency is \(160\): \(50+62+k+14+8=160 \Rightarrow k=160-50-62-14-8=\boxed{26}\). [2]
(c) The largest frequency is \(62\) in the class \(20\le T<40\); so
(i) modal class: \(\boxed{20\le T<40}\). (ii) mid-interval: \(\dfrac{20+40}{2}=\boxed{30}\) minutes. [2]
(d) Use class midpoints \(10,30,50,70,90\) with frequencies \(50,62,26,14,8\):
(e) Maximum possible \(\le 35\) minutes: take all \(50\) from \(0\text{–}20\) and all \(62\) from \(20\text{–}40\) (if they happened to be \(\le 35\)). Total \(\boxed{112}\). [1]
(f) “At least 60 minutes” means classes \(60\text{–}80\) and \(80\text{–}100\): \(14+8=22\) people.
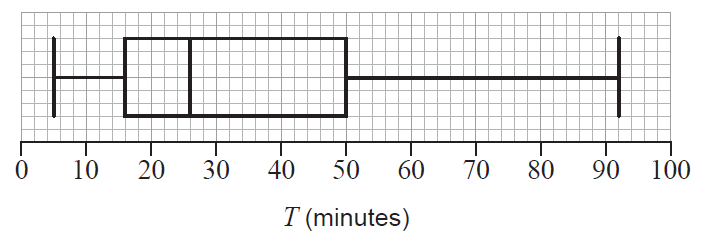
(g) From the boxplot, the median is \(\boxed{26\ \text{minutes}}\). [1]
(h) From the boxplot, \(Q_1=16\), \(Q_3=50\). So \(\text{IQR}=Q_3-Q_1=50-16=\boxed{34\ \text{minutes}}\). [2]
(i) Upper outlier fence \(=Q_3+1.5\,\text{IQR}=50+1.5(34)=\boxed{101}\).
(j) The diagram is not symmetric (e.g., the median is not central in the box and the whiskers differ markedly in length), indicating right skew, so the data are unlikely to be normally distributed. [1]