▶️ Answer/Explanation
(a)
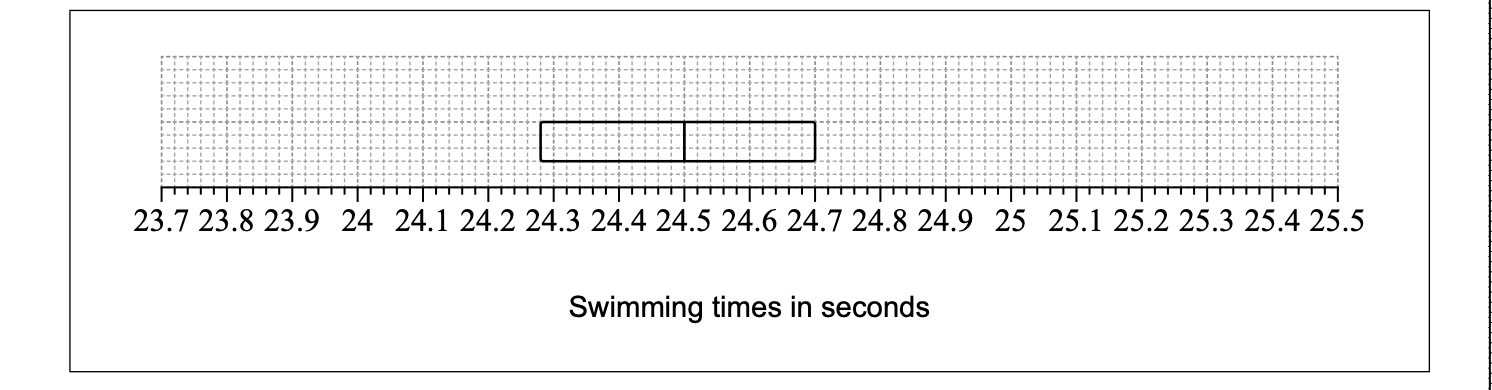
In a box plot, the value \(24.70\) corresponds to the third quartile (\(Q_3\)). Since \(Q_3\) marks the point above which \(25\%\) of the data lies, and there are \(16\) swimmers:
Number of swimmers \(= 0.25 \times 16 = 4\).
\(4\) swimmers.
(b)
From the diagram, the third quartile (\(Q_3\)) is \(24.70\) and the first quartile (\(Q_1\)) is \(24.28\).
\(\text{IQR} = Q_3 – Q_1 = 24.70 – 24.28 = 0.42\).
\(\text{IQR} = 0.42\) seconds.
(c)
(i) Calculate the outlier boundaries:
Upper Boundary \(= Q_3 + 1.5 \times \text{IQR} = 24.70 + 1.5(0.42) = 24.70 + 0.63 = 25.33\).
Lower Boundary \(= Q_1 – 1.5 \times \text{IQR} = 24.28 – 0.63 = 23.65\).
Comparing the given times:
Fastest: \(23.96\) and \(24.12\) (Both \(> 23.65\), so not outliers).
Slowest: \(25.12\) and \(25.40\).
\(25.12 < 25.33\) (Not an outlier).
\(25.40 > 25.33\) (Outlier).
Thus, only \(25.40\) is an outlier.
(ii) To complete the diagram:
– Mark an ‘x’ at \(25.40\) to denote the outlier.
– Extend the upper whisker to the maximum value within the boundary, which is \(25.12\).
– Extend the lower whisker to the minimum value, \(23.96\).