IB Mathematics AI AHL Transformations of graphs MAI Study Notes - New Syllabus
IB Mathematics AI AHL Transformations of graphs MAI Study Notes
LEARNING OBJECTIVE
- Transformations of graphs.
Key Concepts:
- Translations of Graphs
- Reflections of Graphs
- Stretches of Graphs
- Composite Transformations of Graphs
- IBDP Maths AI SL- IB Style Practice Questions with Answer-Topic Wise-Paper 1
- IBDP Maths AI SL- IB Style Practice Questions with Answer-Topic Wise-Paper 2
- IB DP Maths AI HL- IB Style Practice Questions with Answer-Topic Wise-Paper 1
- IB DP Maths AI HL- IB Style Practice Questions with Answer-Topic Wise-Paper 2
- IB DP Maths AI HL- IB Style Practice Questions with Answer-Topic Wise-Paper 3
TRANSLATIONS AND TRANSFORMATIONS OF FUNCTIONS
Transformations describe how a function’s graph changes in position or shape. These include translations (shifts), reflections (flips), and stretches/compressions (scaling). The core function (often called the parent function) stays the same in type but is adjusted visually.
Vertical Translations
These move the graph up or down without altering its shape.
General Form:
$
y = f(x) + a
$
If $a > 0$: moves up by $a$ units.
If $a < 0$: moves down by $|a|$ units.
Question Consider the function \( f(x) = x^2 \))
▶️Answer/ExplanationSolution:
|
Example:
$
f(x) = x^2 \quad \Rightarrow \quad g(x) = x^2 + 3
$
Graph of $f(x)$ shifts up 3 units.
Horizontal Translations
These move the graph left or right.
General Form:
$
y = f(x – a)
$
If $a > 0$: moves right by $a$ units.
If $a < 0$: moves left by $|a|$ units.
Example:
$
f(x) = x^2 \quad \Rightarrow \quad g(x) = (x – 2)^2
$
Graph moves right 2 units.
Note: The sign inside the brackets is opposite the direction.
Question Consider the function \( f(x) = x^2 \))
▶️Answer/ExplanationSolutions:
|
REFLECTIONS
Reflections flip the graph over an axis.
Reflection in the x-axis:
$
y = -f(x)
$
Flips vertically—every y-value becomes its opposite.
Reflection in the y-axis:
$
y = f(-x)
$
Flips horizontally—every x-value is mirrored.
Question Consider the function \( f(x) = x^2 + 9 \)):
▶️Answer/ExplanationSolution:
|
STRETCH AND COMPRESSION
Vertical Stretch and Compression
It affects the height of the graph.
General Form:
$
y = a \cdot f(x)
$
$|a| > 1$: stretched vertically.
$0 < |a| < 1$: compressed vertically.
$a < 0$: reflected in the x-axis.
Example:
$
f(x) = x^2 \Rightarrow g(x) = 3x^2
$
The graph is stretched by a factor of 3.
Horizontal Stretch and Compression
It affects how “wide” the graph appears.
General Form:
$
y = f(bx)
$
$|b| > 1$: compressed horizontally.
$0 < |b| < 1$: stretched horizontally.
$b < 0$: reflected in the y-axis.
Example:
$
f(x) = x^2 \Rightarrow g(x) = f(2x) = (2x)^2 = 4x^2
$
The graph is compressed horizontally by factor $\frac{1}{2}$.
Common Confusion: Inside the function → horizontal effect. Outside the function → vertical effect.
Question: Given the function \( f(x) = x^2 \), consider the transformation $ g(x) = -2 \cdot f(0.5x) $ What are the effects of this transformation on the graph of \( f(x) \)? Describe each transformation step (vertical/horizontal stretch/compression and reflection), and write the simplified form of \( g(x) \). ▶️Answer/ExplanationSolution: $ g(x) = -2 \cdot f(0.5x) = -2 \cdot (0.5x)^2 $ $ g(x) = -2 \cdot 0.25x^2 = -0.5x^2 $ Transformations:
The graph of \( f(x) = x^2 \) becomes wider (horizontal stretch by 2), steeper (vertical stretch by 2), and opens downward (reflected in the x-axis) to form the new function: $ g(x) = -0.5x^2 $ |
COMPOSITE TRANSFORMATIONS
Transformations often relate to composite functions . You can view transformations as function compositions.
Example:
$
g(x) = 2(x – 3)^2 + 1 = h(f(x)), \text{ where:}
$
$f(x) = x – 3$
$h(x) = 2x^2 + 1$
This breaks the transformation into smaller steps using function composition.
Using Technology
Use graphing tools like Desmos or GeoGebra to experiment with transformations:
Add sliders for each parameter (e.g., shift, scale).
Observe real-time changes to the graph.
Compare multiple versions simultaneously.
Sketching Strategy
When sketching transformed graphs:
1. Start with the basic shape of the parent function.
2. Apply reflections first.
3. Follow with stretches/compressions.
4. Then apply translations (shifts).
5. Plot key points to guide the shape.
6. Don’t stress over exact scale—focus on structure and movement.
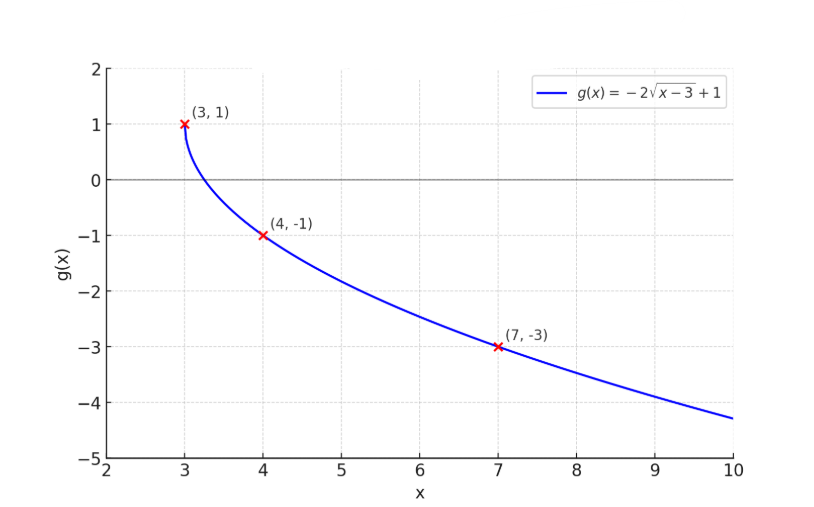
Question: The parent function \( f(x) = \sqrt{x} \) undergoes the following transformations to become the function \( g(x) = -2\sqrt{x – 3} + 1 \). Using the sketching strategy provided:
▶️Answer/ExplanationSolution: \( f(x) = \sqrt{x} \) Inside the function: \( \sqrt{x – 3} \) Coefficient outside: \( -2\sqrt{x – 3} \) Outside +1: \( -2\sqrt{x – 3} + 1 \) Transformations:
Key Points on \( g(x) \):
Domain and Range: Domain: \( x \geq 3 \) |