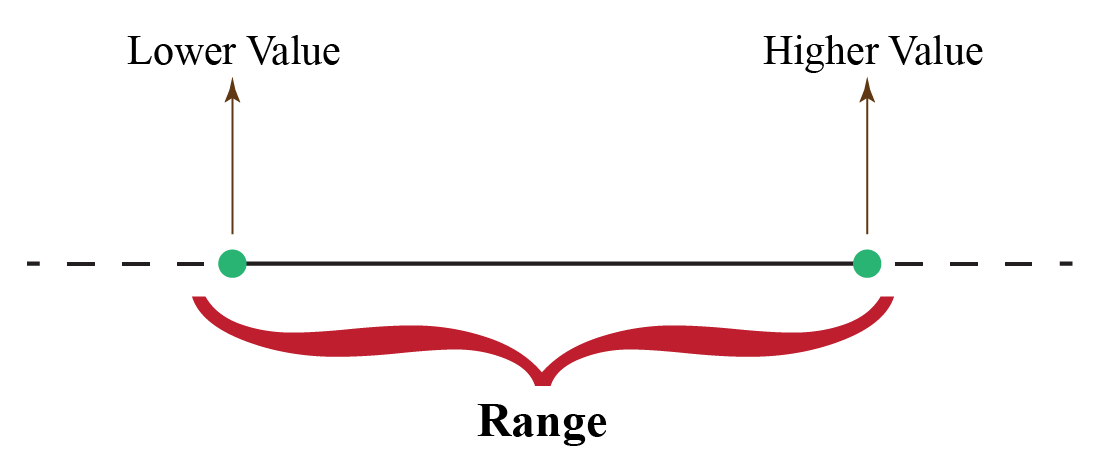
Range
Range is the simplest measure of dispersion. It gives the spread of a dataset by considering the difference between the largest and the smallest values.
Definition of Range
\( \text{Range} = \text{Maximum value} – \text{Minimum value} \)
It shows how widely the data is spread but ignores all intermediate values, so it is not a very reliable measure for irregular data.
Coefficient of Range
Useful for comparing variability of two different datasets.
\( \text{Coefficient of Range} = \dfrac{L – S}{L + S} \)
Where:
- \( L \) = largest value
- \( S \) = smallest value
Range for Grouped Data
For grouped data (class intervals):
\( \text{Range} = \text{Upper limit of last class} – \text{Lower limit of first class} \)
This works only for continuous classes.
Advantages
- Very easy to compute
- Gives quick estimate of variability
Disadvantages
- Depends only on two extreme values
- Highly affected by outliers
- Not reliable for skewed distributions
Example
Find the range of the data: 4, 10, 6, 8, 12.
▶️ Answer / Explanation
Maximum = 12
Minimum = 4
Range = \( 12 – 4 = 8 \)
Range = 8
Example
Find the coefficient of range for the data: 15, 8, 20, 5, 12.
▶️ Answer / Explanation
Largest value \( L = 20 \)
Smallest value \( S = 5 \)
Coefficient of Range \( = \dfrac{L – S}{L + S} = \dfrac{20 – 5}{20 + 5} = \dfrac{15}{25} = 0.6 \)
Coefficient of Range = 0.6
Example
For the grouped data:
Classes: 0–10, 10–20, 20–30, 30–40
Frequencies: 5, 7, 12, 6
Find the range.
▶️ Answer / Explanation
Upper limit of last class = 40
Lower limit of first class = 0
Range = \( 40 – 0 = 40 \)
Range = 40
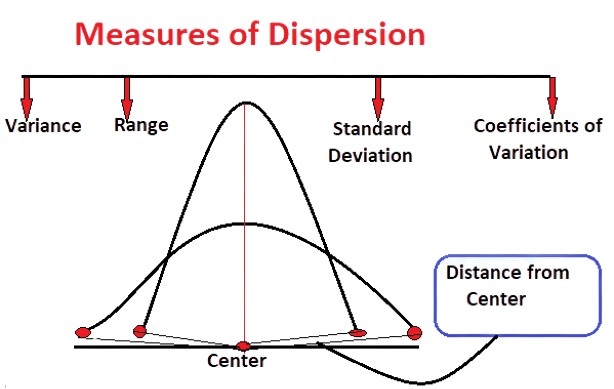
Measures of Dispersion
Measures of dispersion tell us how spread out the values of a dataset are around the average. The three most important measures in JEE are:
- Mean Deviation (M.D.)

- Variance
- Standard Deviation (S.D.)
Mean Deviation (M.D.)
Mean deviation is the average of absolute deviations from mean or median.
(a) Ungrouped Data
\( \text{MD about mean} = \dfrac{\sum |x_i – \bar{x}|}{n} \)
\( \text{MD about median} = \dfrac{\sum |x_i – M|}{n} \)
(b) Grouped Data
\( \text{MD about mean} = \dfrac{\sum f_i |x_i – \bar{x}|}{\sum f_i} \)
\( \text{MD about median} = \dfrac{\sum f_i |x_i – M|}{\sum f_i} \)
Mean deviation about the mean is smaller than about the median for symmetrical distributions.
Variance
Variance measures the average squared deviation from the mean.
(a) Ungrouped Data
\( \sigma^2 = \dfrac{\sum (x_i – \bar{x})^2}{n} \)
Shortcut formula:
\( \sigma^2 = \dfrac{\sum x_i^2}{n} – \bar{x}^2 \)
(b) Grouped Data
\( \sigma^2 = \dfrac{\sum f_i (x_i – \bar{x})^2}{\sum f_i} \)
Shortcut:
\( \sigma^2 = \dfrac{\sum f_i x_i^2}{\sum f_i} – \bar{x}^2 \)
Standard Deviation (S.D.)
S.D. is the positive square root of variance.
\( \sigma = \sqrt{\sigma^2} \)
S.D. is the most important measure of dispersion for JEE.
Coding Method (Shortcut Method) Used for large values in grouped data.
If
\( u_i = \dfrac{x_i – a}{h} \)
Then
\( \bar{x} = a + h\dfrac{\sum f_iu_i}{\sum f_i} \)
\( \sigma = h\sqrt{\dfrac{\sum f_i u_i^2}{\sum f_i} – \left(\dfrac{\sum f_i u_i}{\sum f_i}\right)^2} \)
Comparison of Dispersions
- \( \text{S.D.} \ge \text{Mean Deviation} \ge \text{Quartile Deviation} \)
- S.D. is widely used because of algebraic convenience.
Example
For numbers 2, 4, 6, 8, find the standard deviation.
▶️ Answer / Explanation
Step 1: Mean
\( \bar{x} = \dfrac{2 + 4 + 6 + 8}{4} = 5 \)
Step 2: Variance
\( (x_i – \bar{x})^2 = 9, 1, 1, 9 \)
Variance \( \sigma^2 = \dfrac{20}{4} = 5 \)
Step 3: Standard Deviation
\( \sigma = \sqrt{5} \)
Answer: \( \sigma = \sqrt{5} \)
Example
The frequency distribution is:
x: 10, 20, 30
f: 3, 4, 3
Find the variance.
▶️ Answer / Explanation
Total frequency: \( N = 3 + 4 + 3 = 10 \)
Step 1: Mean
\( \bar{x} = \dfrac{3(10) + 4(20) + 3(30)}{10} = \dfrac{30 + 80 + 90}{10} = 20 \)
Step 2: Compute \( \sum f x^2 \)
\( 3(100) + 4(400) + 3(900) = 300 + 1600 + 2700 = 4600 \)
Step 3: Apply shortcut formula
\( \sigma^2 = \dfrac{\sum f x^2}{N} – \bar{x}^2 = \dfrac{4600}{10} – 20^2 = 460 – 400 = 60 \)
Answer: Variance = 60
Example
Find the mean deviation about the mean for the grouped data:
Class intervals: 0–10, 10–20, 20–30
Frequencies: 5, 3, 2
▶️ Answer / Explanation
Step 1: Midpoints
\( x_i = 5, 15, 25 \)
Step 2: Mean
\( \bar{x} = \dfrac{5(5) + 3(15) + 2(25)}{10} = \dfrac{25 + 45 + 50}{10} = 12 \)
Step 3: Compute \( |x_i – \bar{x}| \)
\( |5 – 12| = 7 \)
\( |15 – 12| = 3 \)
\( |25 – 12| = 13 \)
Step 4: Find M.D.
\( \text{MD} = \dfrac{5(7) + 3(3) + 2(13)}{10} \)
\( = \dfrac{35 + 9 + 26}{10} = \dfrac{70}{10} = 7 \)
Answer: Mean Deviation = 7