Digital SAT Math: Linear functions -Practice Questions - New Syllabus
DSAT MAth Practice questions – all topics
- Algebra Weightage: 35% Questions: 13-15
- Linear equations in one variable
- Linear equations in two variables
- Linear functions
- Systems of two linear equations in two variables
- Linear inequalities in one or two variables
DSAT MAth and English – full syllabus practice tests
Question Easy
The line graph shows the number of near-Earth asteroids discovered by the Spacewatch survey from 2003 to 2010.

During which period was the increase in the number of near-Earth asteroids discovered the greatest?
A) From 2003 to 2004
B) From 2004 to 2005
C) From 2005 to 2006
D) From 2007 to 2008
▶️Answer/Explanation
Ans:D
We will compare the increase in the number of near-Earth asteroids discovered from year to year by examining the vertical distances between points on the graph.
1. From 2003 to 2004:
In 2003, the number of asteroids discovered is approximately 50.8.
In 2004, the number of asteroids discovered is approximately 70.2.
Increase: \( 70.2 – 50.8 = 19.4 \).
2. From 2004 to 2005:
In 2004, the number of asteroids discovered is approximately 70.2.
In 2005, the number of asteroids discovered is approximately 80.3.
Increase: \( 80.3 – 70.2 = 10.1 \).
3. From 2005 to 2006:
In 2005, the number of asteroids discovered is approximately 80.3.
In 2006, the number of asteroids discovered is approximately 90.9.
Increase: \( 90.9 – 80.3 = 10.6 \).
4. From 2007 to 2008:
In 2007, the number of asteroids discovered is approximately 40.8.
In 2008, the number of asteroids discovered is approximately 80.4.
Increase: \( 80.4 – 40.8 = 39.6 \).
By comparing these increases, we see that the greatest increase occurred from 2007 to 2008.
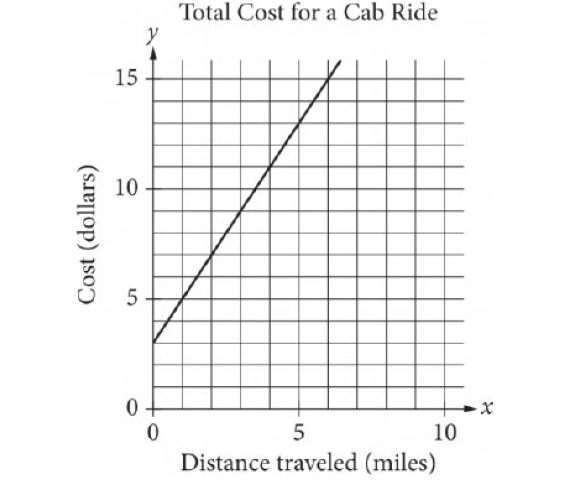
The line graphed in the xy-plane below models the total cost, in dollars, for a cab ride, y, in a certain city during nonpeak hours based on the number of miles traveled, x.

According to the graph, what is the cost for each additional mile travelled, in dollars, of a cab ride?
A) \$2.00
B) \$2.60
C) \$3.00
D) \$5.00
▶️ Answer/Explanation
The linear function \(f\) is defined by \(f(x)=2(x-1)\). What is the value of \(f(4)\)?
A) 1.5
B) 3
C) 6
D) 7
▶️ Answer/Explanation
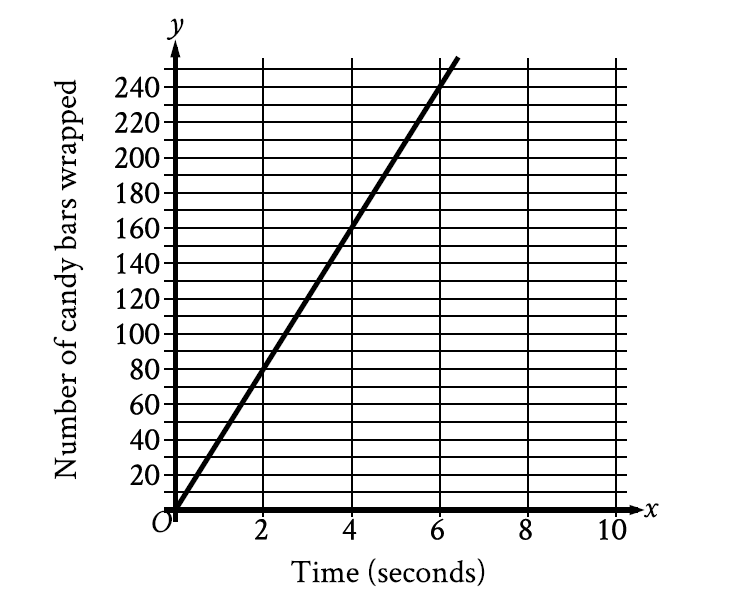
The graph shown models the number of candy bars a certain machine wraps with a label in x seconds.

According to the graph, what is the estimated number of candy bars the machine wraps with a label per second?
A) 2
B) 40
C) 78
D) 80
