▶️ Answer/Explanation
Solution
Ans: B
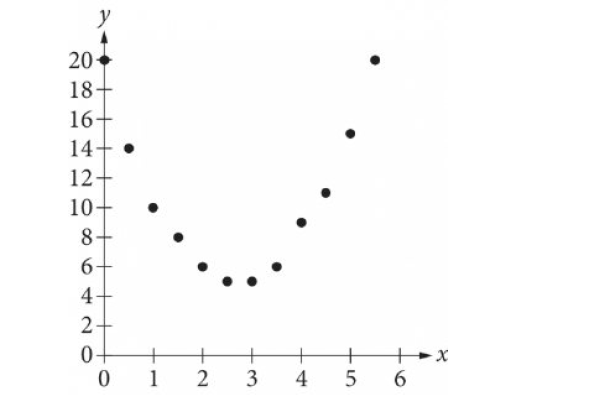
The scatterplot fits an upward parabola with y-intercept near (0, 20) and vertex at x ≈ 2.5.
Check y-intercept: B gives \( y = 2(0)^2 – 11(0) + 20 = 20 \), matching.
Vertex x ≈ 2.5: \( y = 2(2.5)^2 – 11(2.5) + 20 = 5 \), close to vertex y-value.
▶️ Answer/Explanation
Solution
Ans: 40
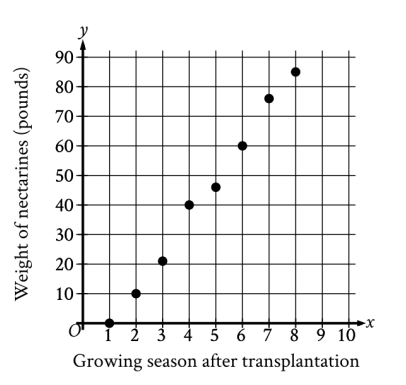
The scatterplot shows a data point at (4, 40).
Thus, during the 4th growing season, the weight of all nectarines was 40 pounds.