4.1 Species, Communities and Ecosystems
In the Species, Communities and Ecosystem unit we will look at how almost the entire surface of the Earth is home to organisms of one kind or another. The will see that there are as many as 10 million different species on Earth and understand where and how they live and interact is a branch of biology. We will also look at how humans are not the most numerous species on Earth, but humankind is having a disproportionate effect on the world’s ecosystems as damage is caused by pollution, rainforest destruction and global warming.
This unit will last 3 class lesons
Essential idea:
- The continued survival of living organisms including humans depends on sustainable communities.
Nature of science:
- Looking for patterns, trends and discrepancies—plants and algae are mostly autotrophic but some are not. (3.1)
- State the trend found in the nutritional patterns of plants and algae.
- Describe the discrepancy in the nutritional pattern of parasitic plants and algae.
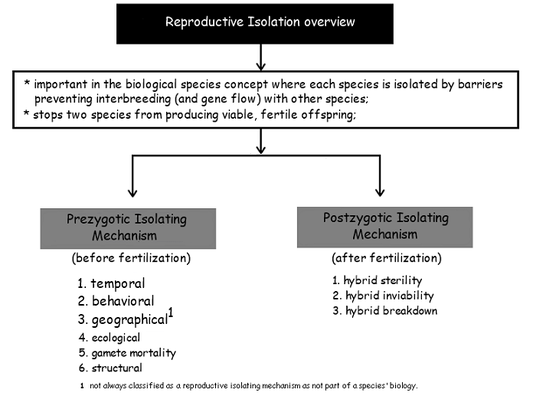
4.1.U1 Species are groups of organisms that can potentially interbreed to produce fertile offspring.
- Describe limitations of the biological species concept.
- Define species according to the biological species concept.
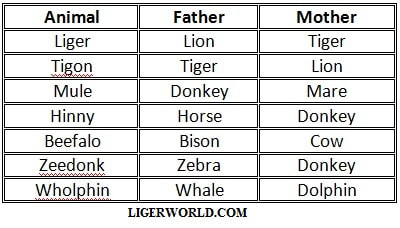
When two members of the same species mate and produce an offspring it is called interbreeding. Their offsprings it is often fertile.
When two different species breed together it is called cross-breeding. This type of breeding happen once in awhile, but the offspring is not fertile, which does not let this to reproduce, because it is infertile.
Interbreeding: When 2 members of same species mate
Cross-breeding: When 2 members of different species mate
- Happens sometimes but cross-bred offspring is usually infertile so genes of 2 species do not mix
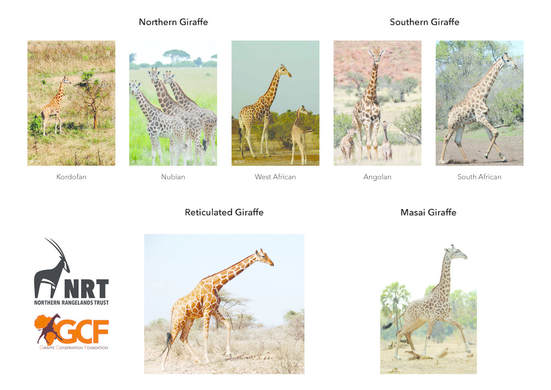
4.1.U2 Members of a species may be reproductively isolated in separate populations.
- Define population.
- Outline how reproductive isolation can lead to speciation.
A population is a group of organisms of the same species that are living in the same area at the same time
Members of a species may be reproductively isolated in separate populations
Organisms that live in different regions (i.e. different populations) are reproductively isolated and unlikely to interbreed, however are classified as the same species if interbreeding is functionally possible
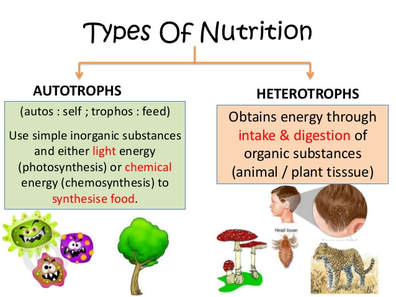
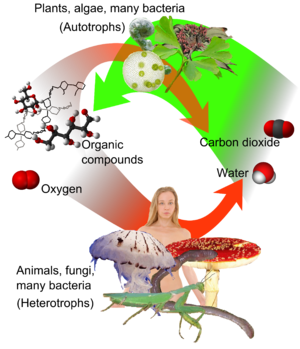
4.1.U3 Species have either an autotrophic or heterotrophic method of nutrition (a few species have both methods).
- Define autotroph and heterotroph.
Living organisms obtain chemical energy in one of two ways:
- Organisms that make their own carbon compounds from carbon dioxide and other simple substances – autotrophic (self-feeding)
- Organisms that obtain their carbon compounds from other organisms – heterotrophic (feeding on others)
- Some unicellular organisms use both methods of nutrition
- Eg Euglena gracilis – has chloroplasts and carries out photosynthesis when there is sufficient light. Can also feed on detritus or smaller organisms by endocytosis.
- Organisms that are not exclusively autotrophic or heterotrophic are mixotrophic
4.1.U4 Consumers are heterotrophs that feed on living organisms by ingestion.
- Describe the feeding behaviors of consumers.
- List three example consumer organisms.
Heterotrophs obtain organic molecules from other organisms via different feeding mechanisms and different food sources. Consequently, heterotrophs can be differentially classified according to their feeding pattern
- Heterotrophs divided into two groups according to the source of organic molecules that they use and the method of taking them in.
- One group of heterotrophs is called consumers
- Consumers feed off other organisms (either still alive or have already been dead for a short time)
- A mosquito sucking blood from a larger animal is a consumer on an organism that’s still alive
- A lion feeding of a gazelle that it has killed is a consumer
- Consumers ingest their food – they take in undigested material from other organisms. They digest it and absorb products of digestion.
- Consumers are sometimes divided into trophic groups according to what other organisms they consume.
- Primary consumers feed on autotrophs
- Secondary consumers feed on primary consumers Lions
4.1.U5 Detritivores are heterotrophs that obtain organic nutrients from detritus by internal digestion.
- Describe the feeding behaviors of detritivores.
- List two example detritivore organisms.
- Organisms discard large quantities of organic matter
- Dead leaves and other parts of plants
- Feathers, hair, and dead parts of animal bodies
- Feces from animals
- This dead organic matter rarely accumulates in ecosystem – is used as a source of nutrition by two groups of heterotroph-detritivores and saprotrophs.
- Detritivores ingest dead organic matter then digest it internally and absorb products of digestion
- Large multicellular detritivores such as earthworms ingest dead matter into their gut
- Unicellular organisms ingest into food vacuoles. organic matter discarded by organisms
- Rarely accumulate in ecosystem → used as source of nutrition for detritivores & saprotrophs detritivores
- Ingest dead organic matter → digest internally → absorb products of digestion
- example ; earthworms (large multicellular): ingest dead matter into gut
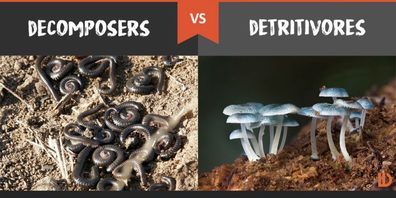
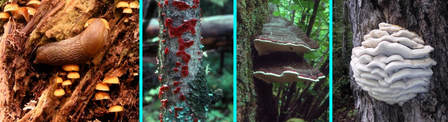
4.1.U6 Saprotrophs are heterotrophs that obtain organic nutrients from dead organisms by external digestion.
- Describe the feeding behaviors of saprotrophs.
- List two example saprotroph organisms.
Saprotrophs secrete digestive enzymes into dead organic matter and digest it externally – absorb products of digestion. Also known as decomposers – they break down carbon compounds in dead organic matter and release elements such as nitrogen into ecosystem so they can be used again by other organisms secrete digestive enzymes into dead organic matter → digest externally → absorb products of digestion
- example; bacteria & fungi
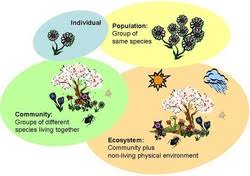
4.1.U7 A community is formed by populations of different species living together and interacting with each other.
- Define species, population and community.
- Give an example of a community of organisms.
Sometimes interaction between two species is of benefit to one species and harms the other (eg parasite and host). Sometimes interaction benefits both species (eg hummingbird and flower – hummingbird feeds on nectar and pollinates it)
One species can never live in isolation
A group of populations living together and interacting with each other – community
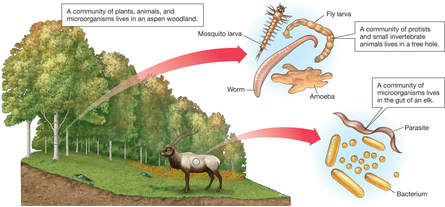
4.1.U8 A community forms an ecosystem by its interactions with the abiotic environment.
- Define abiotic and ecosystem.
A community is composed of all organisms living in an area. Community of organisms in an area and their nonliving environment – ecosystem is a highly complex interacting system) The system has both abiotic and biotic factors. The organisms depend on the non-living surroundings of air, water, soil, rock. –> abiotic environment.
Many interactions take place between organisms and the abiotic environment
- Rainforest: Each layer is a different habitat as there are different species living in each layer.
- Light intensity affects each habitat – there will be different species of autotrophs and will therefore provide different food for different consumers.
- Rocky intertidal zone: All in the same ecosystem but have multiple habitats because of the amount of water available – how much time they spend under water
- Depends a lot on the abiotic factors
- Temperature also affects the different habitats
4.1.U9 Autotrophs obtain inorganic nutrients from the abiotic environment.
- Define nutrient.
- List the common nutrients needed by organisms.
- Outline how nutrients enter living systems.
Autotrophs synthesise organic molecules from simple inorganic substances
- Living organisms need a supply of chemical elements:
- Carbon, hydrogen, oxygen (make carbohydrates, lipids, other carbon compounds)
- Nitrogen and phosphorus needed to make compounds
- comes from the soil (for plants taking up nutrients from the ground)
- 15 other elements are needed too
- Autotrophs obtain all of the elements that they need as inorganic nutrients from the abiotic environment (including carbon and nitrogen)
- Heterotrophs obtain these as part of the carbon compounds in their food.
- Obtain inorganic nutrients from abiotic environment (sodium, potassium, calcium)
- *NUTRIENT CYCLE*: plant takes nutrients from the soil -> primary consumer eats the plant and gets the nutrients from the plant -> secondary consumer gets nutrients from primary consumer and so forth
- State that chemical elements can be recycled but energy can not.
- Outline the generalized flow of nutrients between the abiotic and biotic components of an ecosystem
Nutrients refer to the material required by an organism, and include elements such as carbon, nitrogen and phosphorus. The supply of inorganic nutrients on Earth is finite – new elements cannot simply be created and so are in limited supply
- Chemical elements can be endlessly recycled
- Organisms absorb the elements they require from abiotic environment, use them, then return them to the environment with atoms unchanged
- Passed from organism to organism before it is released back into abiotic environment
- Nutrient = an element that an organism needs (in this context)
4.1.U11 Ecosystems have the potential to be sustainable over long periods of time.
- Define sustainability.
- Give an example of an unsustainable practice.
- Outline three requirements of a sustainable ecosystem.
Ecosystems describe the interaction between biotic components (i.e. communities) and abiotic components (i.e. habitat). They are largely self-contained and have the capacity to be self-sustaining over long periods of time
There are three main components required for sustainability in an ecosystem:
- Energy availability – light from the sun provides the initial energy source for almost all communities
- Nutrient availability – saprotrophic decomposers ensure the constant recycling of inorganic nutrients within an environment
- Recycling of wastes – certain bacteria can detoxify harmful waste byproducts (e.g. denitrifying bacteria such as Nitrosomonas)Sustainable: it can continue indefinitely
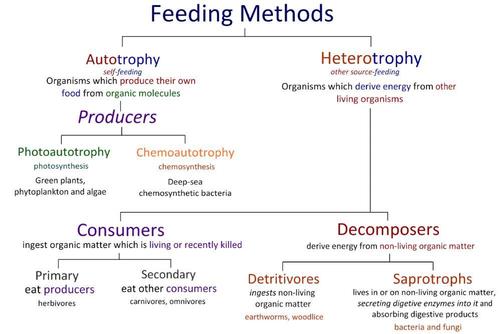
4.1.S1 Classifying species as autotrophs, consumers, detritivores or saprotrophs from a knowledge of their mode of nutrition.
- Use a dichotomous key to identify the mode of nutrition of an organism.
Species can be classified according to their mode of nutrition
- Autotrophs produce their own organic molecules using either light energy or energy derived from the oxidation of chemicals
- Heterotrophs obtain organic molecules from other organisms via one of three methods:
- Consumers ingest organic molecules from living or recently killed organisms
- Detritivores ingest organic molecules found in the non-living remnants of organisms (e.g. detritus, humus)
- Saprotrophs release digestive enzymes and then absorb the external products of digestion (decomposers)
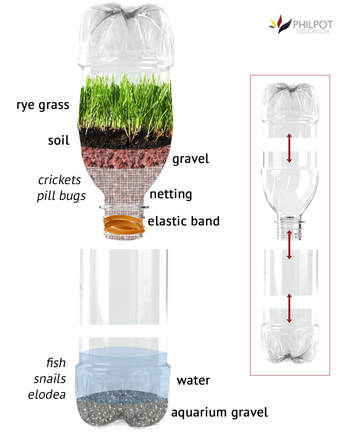
4.1.S2 Setting up sealed mesocosms to try to establish sustainability. (Practical 5)
- Outline why sampling must be random.
- Explain methods of random sampling, including the use of a quadrat.
- State the null and alternative hypothesis of the chi-square test of association.
- Use a contingency table to complete a chi-square test of association.
Mesocosms: small experimental areas set up as ecological experiments
- Fenced-off enclosures in grassland or forest could be used as terrestrial mesocosms
- Tanks set up in the laboratory can be used as aquatic mesocosms
Making a Self-Sustaining Terrarium
A terrarium can be created using a glass or plastic bottle with a lid, according to the following steps:
1. Building a verdant foundation
- Add a bottom layer of pebbles, gravel or sand – this layer exists for drainage (smaller vessels require thinner rock layers)
- Add a second thin layer of activated charcoal – this will prevent mold and help to aerate the soil
- Spread a thin cover of sphagnum moss (or use an organic coffee filter) to create a barrier between the lower layers and soil
- The final layer is the pre-moistened growing medium (i.e. potting mix)
2. Selecting the right plants
- Ideally, choose plants that are both slow growing and thrive in a bit of humidity (e.g. most ferns, club moss, etc.)
- Inspect the plant thoroughly for any signs of disease or insects before introducing to the terrarium
3. Maintaining appropriate conditions
- Ensure the terrarium is placed in a location that provides a continuous source of light
- Locate the terrarium in a place that does not experience fluctuating temperature conditions (i.e. avoid direct sunlight)
- Do not initially over-water the plants – once the right humidity is established, a terrarium can go months without watering
- Occasional pruning may be required – however, as level of soil nutrients decrease, plant growth should slow down
4.1.S3 Testing for association between two species using the chi-squared test with data obtained by quadrat sampling.
- Calculate a chi-square statistic based on observed and expected values.
- State the null and alternative hypothesis of statistical tests.
- Determine if the null hypothesis is supported or rejected given a critical value and a calculated statistic.
- State the minimum acceptable significance level (p value) in published research.
- Explain the meaning of a “statistically significant” result, including the probability of chance having a role in the result
The presence of two species within a given environment will be dependent upon potential interactions between them
If two species are typically found within the same habitat, they show a positive association
- Species that show a positive association include those that exhibit predator-prey or symbiotic relationships
If two species tend not to occur within the same habitat, they show a negative association
- Species will typically show a negative association if there is competition for the same resources
- One species may utilise the resources more efficiently, precluding survival of the other species (competitive exclusion)
- Both species may alter their use of the environment to avoid direct competition (resource partitioning)
If two species do not interact, there will be no association between them and their distribution will be independent of one another
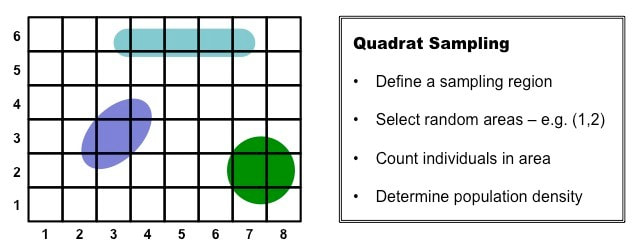
Quadrat Sampling
The presence of two species within a given environment can be determined using quadrat sampling
- A quadrat is a rectangular frame of known dimensions that can be used to establish population densities
- Quadrats are placed inside a defined area in either a random arrangement or according to a design (e.g. belted transect)
- The number of individuals of a given species is either counted or estimated via percentage coverage
- The sampling process is repeated many times in order to gain a representative data set
Quadrat sampling is not an effective method for counting motile organisms – it is used for counting plants and sessile animals
- In each quadrat, the presence or absence of each species is identified
- This allows for the number of quadrats where both species were present to be compared against the total number of quadrats
Chi-Squared Tests
A chi-squared test can be applied to data generated from quadrat sampling to determine if there is a statistically significant association between the distribution of two species
A chi-squared test can be completed by following five simple steps:
- Identify hypotheses (null versus alternative)
- Construct a table of frequencies (observed versus expected)
- Apply the chi-squared formula
- Determine the degree of freedom (df)
- Identify the p value (should be <0.05)
4.1.4S Recognizing and interpreting statistical significance.
- Define mesocosm.
- List three example mesocosms.
- Outline requirements of setting up a mesocosm.
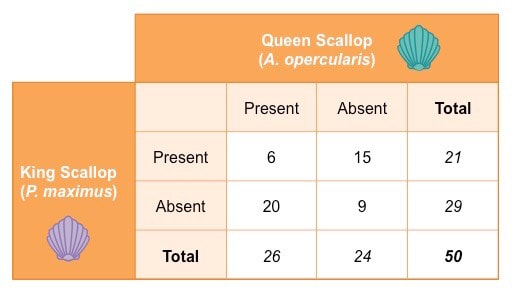
The presence or absence of two species of scallop was recorded in fifty quadrats (1m2) on a rocky sea shore
The following distribution pattern was observed:
- 6 quadrats = both species ; 15 quadrats = king scallop only ; 20 quadrats = queen scallop only ; 9 quadrats = neither species
A chi-squared test seeks to distinguish between two distinct possibilities and hence requires two contrasting hypotheses:
- Null hypothesis (H0): There is no significant difference between the distribution of two species (i.e. distribution is random)
- Alternative hypothesis (H1): There is a significant difference between the distribution of species (i.e. species are associated)
Step 2: Construct a table of frequencies
A table must be constructed that identifies expected distribution frequencies for each species (for comparison against observed)
Expected frequencies are calculated according to the following formula:
- Expected frequency = (Row total × Column total) ÷ Grand total

The formula used to calculate a statistical value for the chi-squared test is as follows:
Where: ∑ = Sum ; O = Observed frequency ; E = Expected frequency
These calculations can be broken down for each part of the distribution pattern to make the final summation easier
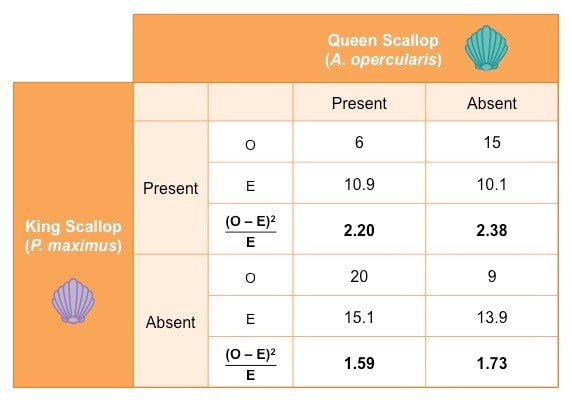
Based on these results the statistical value calculated by the chi-squared test is as follows:
- 𝝌2 = (2.20 + 2.38 + 1.59 + 1.73) = 7.90
Step 4: Determine the degree of freedom (df)
In order to determine if the chi-squared value is statistically significant a degree of freedom must first be identified
- The degree of freedom is a mathematical restriction that designates what range of values fall within each significance level
The degree of freedom is calculated from the table of frequencies according to the following formula:
df = (m – 1) (n – 1)
Where: m = number of rows ; n = number of columns
- When the distribution patterns for two species are being compared, the degree of freedom should always be 1
Step 5: Identify the p value
The final step is to apply the value generated to a chi-squared distribution table to determine if results are statistically significant
- A value is considered significant if there is less than a 5% probability (p < 0.05) the results are attributable to chance
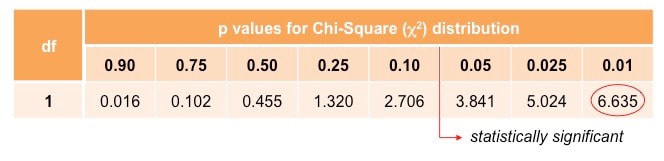
When df = 1, a value of greater than 3.841 is required for results to be considered statistically significant (p < 0.05)
- A value of 7.90 lies above a p value of 0.01, meaning there is less than a 1% probability results are caused by chance
- Hence, the difference between observed and expected frequencies are statistically significant
As the results are statistically significant, the null hypothesis is rejected and the alternate hypothesis accepted:
- Alternate hypothesis (H1): There is a significant difference between observed and expected frequencies
- Because the two species do not tend to be present in the same area, we can infer there is a negative association between them
Ecosystem
Table of Contents
- What is Ecosystem?
- Ecosystem- Structure and Function
- Productivity
- Decomposition
- Energy Flow in Ecosystem
- Food Chain
- Ecological Pyramid
- Ecological Succession
- Nutrient Cycling
- Ecosystem Services
What is Ecosystem?
- The communication between the living life form and the non-living environment is called Ecosystem.
Ecosystem – Structure and Function
- Interaction of biotic and abiotic parts brings about a physical structure that is normal for every kind of Ecosystem.
- Identification and portrayal of plant and creature species of an ecosystem provides its species composition.
- Distribution of various species vertically possessing diverse levels is called stratification.
- The parts of the ecosystem are believed to work as a unit:
- Productivity
- Decomposition
- Energy stream
- Nutrient cycle
Description of pond as an ecosystem
- The abiotic parts incorporate all broke down organic and inorganic substances and the rich soil store at the base of the lake.
- The sunlight based information, cycle of temperature, length of the day, regulates the rate of capacity of the whole lake.
- The producer (autotrophic) incorporates phytoplankton, some green growth (algae) and the gliding, submerged and peripheral plants found on edge of the lake.
- The consumers are spoken to by zooplankton, swimming freely and basal staying animals.
- The decomposers are the bacteria, fungi particularly inexhaustible at the base of the lake.
Basic events (in terms of function) in an Ecosystem
- Conversion of inorganic into a natural material (Photosynthesis) with the help of producers
- Autotrophs being consumed by heterotrophs
- Decomposition and mineralization of the dead natural matter to discharge them back to be used again by the autotroph
- There is unidirectional stream of vitality towards the higher trophic levels and its dispersal and loss as warmth to the earth
Fig: Pond Ecosystem (above) and Terrestrial Ecosystem (below)
Productivity
Primary Productivity
- The measure of biomass or natural matter created per unit range over a time frame by plants amid photosynthesis
- It is expressed as weight (g-2) or vitality (kcal m-2)
- The rate of biomass generation is called productivity
- Gross primary productivity (GPP): is the rate of creation of natural matter amid photosynthesis.
- Net primary productivity:
- A significant measure of vitality is used by plants while respiration
- Gross primary productivity minus loss through respiration (R) is the net primary productivity.
- GPP – R = NPP
- Net primary productivity is the accessible biomass for the utilization to heterotrophs (herbivore and decomposers)
Secondary Productivity
Secondary Productivity is characterized by the rate of arrangement of new natural matter by the consumer.
Decomposition
- Earthworm is said to be “farmer’s friend”
- Breakdown the intricate natural matter
- Loosening of the soil helps in air circulation and passage of root
- The decomposers decompose complex natural matter into inorganic substances such as nutrients, water, and carbon dioxide, called decomposition
- Remains of dead plants, for example, leaves, flowers, bark remains of dead animals, including fecal matter, constitute the detritus
- The procedure of decomposition is finished in following steps:
- Fragmentation: Breakdown of debris by detritivore (earthworm) into smaller and simpler particles
- Leaching: Inorganic supplements that are water solvent go down into the horizon of the soil and get hastened as inaccessible salts
- Catabolism: Bacterial and parasitic enzymes debase waste into basic inorganic substances
- Humification: Accumulation of amorphous substances that are dark in color is called Humus
The significance of humus
- High imperviousness to microbial activity
- Undergo deterioration at a moderate rate
- Being colloidal in nature, it serves as a repository for supplements
- Mineralization: The humus is further broken down by a few microorganisms and inorganic supplements get released
Factors that affects rate of Decomposition
- Decomposition is generally a process that needs oxygen
- Detritus rich in lignin and chitin has a moderate rate of decomposition
- Detritus rich in substances that are soluble in water like sugar and nitrogen has quicker decomposition
- Temperature and soil dampness are most vital climatic element that regulates decomposition
- Warm and sodden environment support decomposition
Anaerobiosis, dryness and, low temperature restrain decomposition.
Energy Flow in Ecosystem
- Except for remote ocean aqueous ecosystem, the sun is the main source of vitality for all ecosystems on earth
- Less than half of occurrence solar radiation is Photosynthetically Active Radiations. (PAR)
- Plants catch 2-10 % of PAR and utilized as a part of photosynthesis
- All living beings rely on upon the producers, either specifically or by implication
- Flow of energy in the ecosystem is unidirectional i.e. vitality is exchanged from producer to consumers
- Energy exchange is not supreme, and unconstrained unless vitality is degraded it can not be exchanged. At the point when vitality is exchanged starting with one trophic level then onto the next, a significant amount of vitality is lost as warmth to the earth.
- Only 10% of vitality is exchanged from one trophic level to other
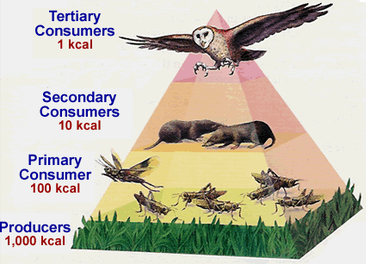
Fig: Energy flow (10% of energy is transferred at successive trophic levels)
Food Chain
- Grazing food chain: it moves from producers through herbivore to meat eater (carnivores)
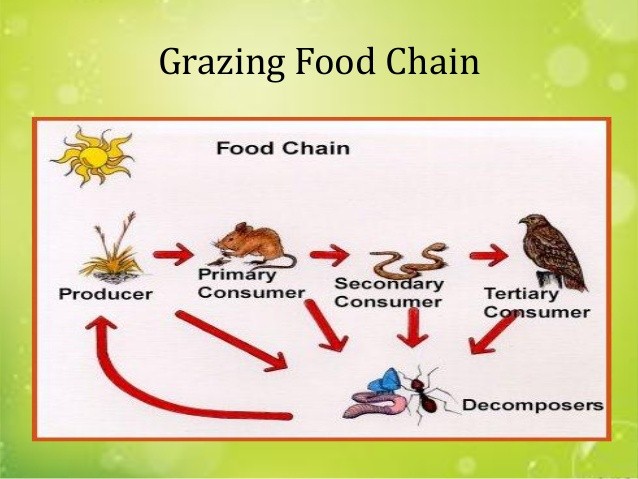
Fig a: Grazing Food Chain
- Detritus food chain: Begins with dead natural matter (detritus) and go through detritus feeding life forms in soil to living beings nourishing on detritus-feeders
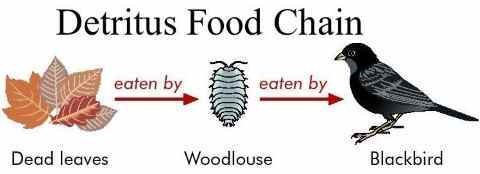
Fig b: Detritus Food Chain
- In oceanic ecosystem GFC is the significant channel for energy flow
- In terrestrial ecosystems a much bigger portion of vitality flows through the detritus food chain than through GFC
- Many different food chains are normally interconnected e.g. a particular herbivore of one food chain may become food of carnivores in other food chains. Such interconnected grid of food chains is called food web
- Trophic level: A gathering of living beings independent of their size having same source of vitality or comparative food propensity constitute a trophic level
- Standing crop: every trophic level has a specific mass of living material at a specific time called as the standing crop
- The standing crop is measured as the mass of living creatures (biomass) or the number in a unit region
- The number of trophic levels in a food chain is confined by 10% flow of vitality, less measure of vitality accessible to the last trophic level
Ecological Pyramid
An ecological pyramid (additionally called energy pyramid, trophic pyramid, or now and again food pyramid) is a graphical representation intended to demonstrate the biomass or bio efficiency at each trophic level in any given ecosystem. The trophic structure and capacity of progressive trophic levels, i.e. Producers → Herbivores → Carnivores, might be indicated graphically by methods called ecological pyramids where the first or producer level constitutes the base of the pyramid and the progressive levels, the levels making the pinnacle. Ecological pyramids were first introduced by Charles Elton (1927) and are, in this manner, additionally called Eltonian pyramids. Ecological pyramids are of three general sorts:
- Pyramid of Energy
- Pyramid of Numbers
- Pyramid of Biomass
Pyramid of Energy
The energy pyramid or the pyramid of energy portrays the general way of the ecosystem. Amid the stream of energy from living forms to other, there is a significant loss of energy as warmth. In primary producers such as the autotrophs, there is more measure of energy accessible. The minimum energy is accessible in the tertiary consumers. Along these lines, the shorter food chain has more measure of energy accessible even at the most elevated trophic level.
- The energy pyramid is constantly upright and vertical
- This pyramid demonstrates the stream of energy at various trophic levels
- It portrays, the energy is least at the most astounding trophic level and is greatest at the most reduced trophic level
- At each trophic level, there is progressive loss of energy as warmth and breath, etc.

Fig. a: Pyramid of Energy
Pyramid of Numbers
The pyramid of numbers portrays the relationship as far as the quantity of producers, herbivores and the carnivores at their progressive trophic levels are concerned. There is an abatement in the quantity of people from the lower to the higher trophic levels. The number pyramid differs from one ecosystem to another ecosystem. There are three forms of the pyramid of numbers:
- Upright pyramid of number
- Partly upright pyramid of number and
- Inverted pyramid of number
Upright Pyramid of Number
Such a sort of pyramid number is found in the grassland and aquatic ecosystem, in these ecosystems there are various little autotrophs which bolster lesser herbivores which thus bolster littler number of carnivores and henceforth this pyramid is upright.
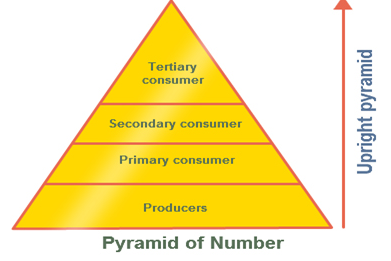
Fig. b: Upright Pyramid of Number
Partly Upright pyramid of Number
It is found in the woodland ecosystem where the quantity of producers are lesser in number and bolster a more prominent number of herbivores and which thus bolster a less number of carnivores.
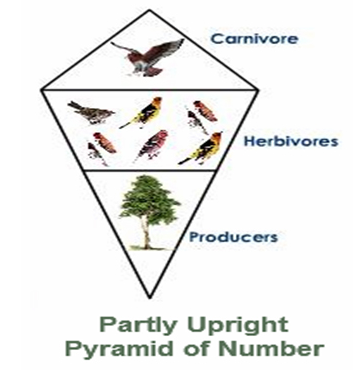
Fig. c: Partly Upright Pyramid of Number
Inverted Pyramid of Number
Such a sort of ecological pyramid is seen in parasitic food chain where one primary producer bolsters various parasites which bolster all the more hyperparasites.
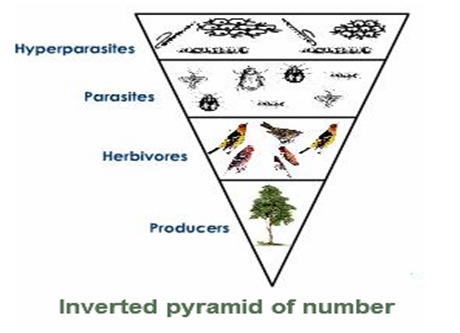
Fig. d: Inverted pyramid of number
Pyramid of Biomass
The pyramid of biomass is more central, they speak of the quantitative connections of the standing crops. In this pyramid, there is a slow decline in the biomass from the producers to the higher trophic levels. The biomass here is gathered from every bolstering level and are then dried and weighed. This dry weight is the biomass and it speaks to the measure of energy accessible as a natural matter of the life forms. In this pyramid, the net dry weight is plotted to that of the producers, carnivores, herbivores, and so on.
There are two sorts of pyramid of biomass, they are:
- Upright pyramid of biomass and
- Inverted pyramid of biomass.
Upright Pyramid of Biomass
Such a case happens when the bigger net biomass of producers maintain a little weight of consumers.
For Example: Forest ecosystem.
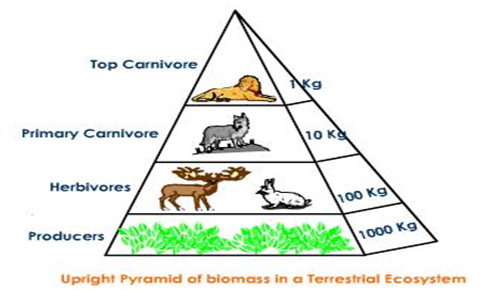
Fig. e: Upright Pyramid of Biomass
Inverted Pyramid of Biomass
Such a case happens when the producer’s smaller weight supports the larger weight of consumers. For example: Aquatic ecosystem.
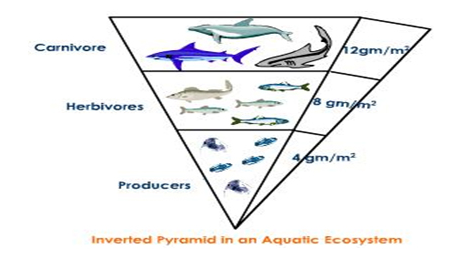
Fig. f: Inverted Pyramid in an Aquatic Ecosystem
Limitations of Ecological Pyramids
- It does not consider similar species having a place with at least two trophic levels
- It expect a basic food chain, it never exits in nature
- It does not oblige food web
- Saprophytes are placed in ecological pyramids
Ecological Succession
- The slow and genuinely unsurprising change in the species piece of a given zone is called Ecological Succession
- Structure and composition of the group always show signs of change because of changing natural condition
- This change is efficient and successive, parallel with the adjustments in the Physical Environment
- All the progressions lead at long last to a group that is in close harmony with the earth and that is called Climax Community
- During succession, a few species colonize and territory and their populations turn out to be increasingly various, though populations of different species decay and even vanish
- The whole sequences of groups that progressively change in a given zone are known as sere
- The individual transitional groups are named as seral stages
- In the progressive seral organizes there is an adjustment in the diversity of species of life forms, increase in number of species and aggregate biomass
Primary Succession:
Primary succession that begins where no living life forms are there- these could be ranges where no living creature ever existed might be an uncovered rock or new water body.
Secondary Succession:
Secondary succession that begins in regions that some way or another, lost all the living beings that existed there.
- Primary succession happens in:-
- newly cooled magma
- bare rock
- newly made lake or repository
- Secondary succession starts in ranges where regular biotic groups have been devastated, for example,
- In deserted homestead lands
- Burned or cut woodland,
- land that has been overflowed
- Since some soil or silt is available, secondary succession is quicker than primary succession
Succession in plants
- Based on the way of living space – whether it is water or it is in extremely dry regions succession of plants is called hydrarch or xerarch
- Hydrarch succession happens in water territories and the successional arrangement progress from hydric to a mesic condition
- Xerarch succession happens in dry territories and the arrangement advance from xeric to mesic conditions
- Both hydrarch and xerarch successions prompt to medium water conditions (mesic) – neither excessively dry (xeric) nor excessively wet (hydric)
Xerarch Succession: Succession in bare rock:
- The species that attacks exposed territory are known as pioneer species
- In primary succession on exposed rock, the pioneer species to be grown is the lichen
- Lichen secretes corrosive materials to break down the rock, leading to weathering and soil development
- The small quantity of soil prompts to the development of bryophytes (greeneries)
- The greeneries accelerate the procedure of soil aggregation by catching wind-blown particles
- Lichen greenery carpet gives reasonable substratum to the germination of seeds of herbaceous plants
- Gradually more soil is aggregated and herbaceous species clear a path for the intrusion of bushes took after by trees
- The climax group is by and large ruled by trees
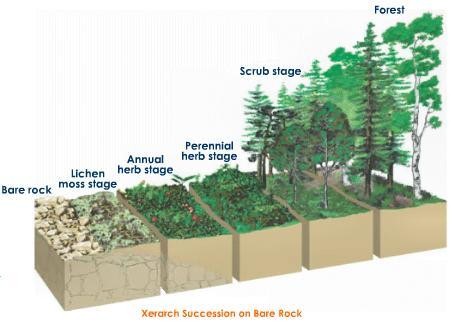
Fig a: Xerarch Succession on Bare Rock
Hydrarch (succession in aquatic environment)
- The pioneer species in primary succession in water are phytoplankton
- Zooplanktons
- Sub consolidated plant organize. (established hydrophytes)
- Sub combined and free-gliding plant stage
- Reed-swamp stage
- Marsh-meadow stage
- Shrub stage
- Trees
- The climax again would be the backwoods
- All the succession whether occurring in water or ashore continues to a comparable climax group – the mesic
Fig b: Hydrarch Succession Stages
Nutrient Cycling
- Organism needs consistent supply of supplements to develop, divide, and regulate different body capacities
- Standing state: the sum nutrients, for example, carbon, calcium, phosphorus, nitrogen, and so on present in soil at any given time
- Nutrient cycling: The development of nutrient components through the different part of an ecosystem is called nutrient cycling.
- Alternate name of nutrient cycling is Biogeochemical Cycle
- Nutrient cycles are of two sorts:
- Gaseous Cycle
- Sedimentary Cycle
- The store for vaporous kind of nutrient cycle (nitrogen, carbon) exists in the environment
- The store for sedimentary cycle (sulfur, phosphorus) is Earth’s covering
- Environmental variables like soil, pH, dampness, temperature regulate the rate of arrival of nutrient into the climate
- The capacity of the repository is to meet the shortage which happens because of unevenness in the rate of efflux and influx
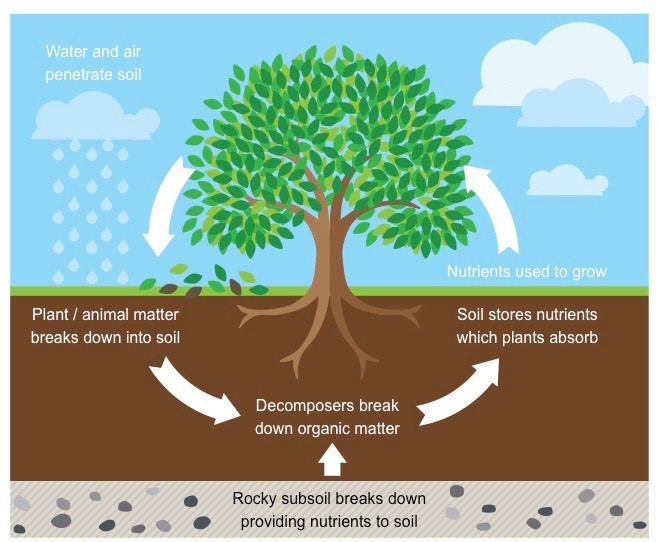
Fig: Nutrient Cycle
Ecosystem – Carbon cycle
- Carbon constitutes 49 % of dry weight of living being
- Out of aggregate worldwide carbon:
- 71 % carbon was discovered broke down in the sea
- About 1 % in the climate
- 4 X 10¹³ kg of carbon is settled in the biosphere by photosynthesis, every year.
- Large measure of carbon came back to the climate as CO2 through respiratory processes of producers and consumers.
- Decomposers return back the CO2 to the reservoir through the process of decomposition.
- Some measure of Carbon is lost to silt and expelled from the flow.
- Burning wood, backwoods fire, ignition of natural matter, fossil fuel, volcanic exercises are extra hotspots for discharging CO2 to air.
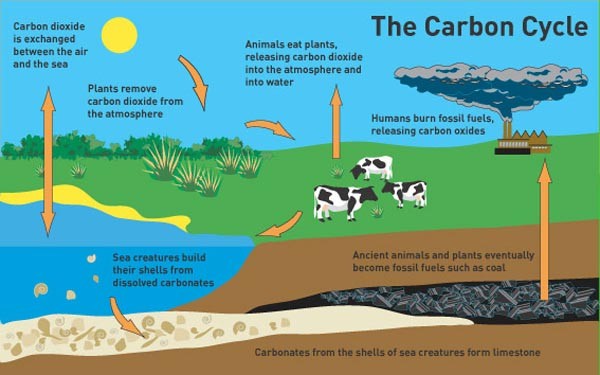
Fig: Carbon Cycle
Influence of human activity on Carbon cycling
- Massive blazing of fossil fuel for vitality and transport
- Rapid deforestation
- Increased the rate of arrival of CO2 into the air
Ecosystem Phosphorus cycle
- Phosphorus is a noteworthy constituent of nucleic acids, cellular membranes and cell vitality exchange system, adenosine triphosphate (ATP)
- Animals require phosphorus to make shells, teeth, and bones.
- Reservoir pool of phosphorus is the stone, which contains phosphorus as phosphates
- During rock weathering, a little measure of phosphates broke up in soil arrangement and are consumed by the underlying foundations that are the roots of the plants
- Herbivore and different animals get the natural type of phosphorus from plants
- The dead life forms and waste products are deteriorated by phosphate-solubilizing bacteria discharging phosphorus
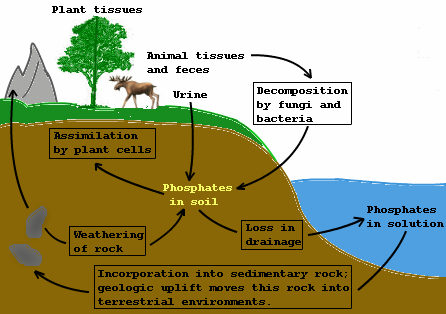
Fig: Phosphorus Cycle
How phosphorus cycle differs from carbon cycle?
- There is no respiratory arrival of phosphorus into the air
- Atmospheric contributions of phosphorus through precipitation are quite small
- Gaseous trade of phosphorus amongst life form and environment are immaterial
Ecosystem Services

Fig: Ecosystem Services
- The results of ecosystem procedures are named as Ecosystem services
- Healthy woods ecosystems sanitize air and water
- Mitigate dry spells and surge
- Cycle supplements
- Generates ripe soil
- Provide natural life territory
- Maintain biodiversity
- Pollinate crops
- Provide capacity site for carbon
- Provides spiritual, social and aesthetic qualities
PAR: Photosynthetically Active Radiation
GAP: Gross Primary Productivity
NPP: Net Primary Productivity
DFC: Detritus Food Chain
GFC: Grazing Food chain