Maximum and Minimum Values
Definition:
Maximum: The highest point (y-value) of a function within a given domain.
Minimum: The lowest point (y-value) of a function within a given domain.
Types:
Global (Absolute): The highest/lowest point over the entire domain.
Local (Relative): The highest/lowest point within a small interval (but not necessarily the entire graph).
Example:
For \( f(x) = -x^2 + 4x + 5 \), the vertex (highest point) is at (2, 9).
Intercepts
X-intercepts (Roots):
Where \( y = 0 \) (graph crosses the x-axis).
Found by solving \( f(x) = 0 \).
Y-intercepts:
Where \( x = 0 \) (graph crosses the y-axis).
Found by evaluating \( f(0) \).
Example For \( f(x) = x^2 – 4x + 3 \): Find x and y intercept. ▶️Answer/ExplanationSolution x-intercepts: \( (1, 0) \) and \( (3, 0) \) (solutions to \( x^2 – 4x + 3 = 0 \)). y-intercept: \( (0, 3) \) (since \( f(0) = 3 \)). |
Symmetry
Even Functions:
Symmetric about the y-axis (\( f(-x) = f(x) \)).
Example:
\( f(x) = x^2 \).
Odd Functions:
Symmetric about the origin (\( f(-x) = -f(x) \)).
Example:
\( f(x) = x^3 \).
Asymptotes (Vertical & Horizontal)
Vertical Asymptotes:
Occur where a function is undefined (e.g., denominator = 0).
Example:
\( f(x) = \frac{1}{x-3} \) has a vertical asymptote at \( x = 3 \).
Horizontal Asymptotes:
Describe end behavior as \( x \rightarrow \pm \infty \).
Example:
\( f(x) = \frac{2x}{x+1} \) approaches \( y = 2 \).
Using Graphing Technology
Key Features to Check:
Zeros (Roots): Where \( f(x) = 0 \).
Extrema: Max/min points.
Intersections: Points where two graphs meet.
Effects of Parameters (Transformations)
General Form:
\( f(x) = a(x – h)^2 + k \) (for quadratics).
Impact of Parameters:
a: Controls width and direction (up/down).
h: Shifts graph left/right.
k: Shifts graph up/down.
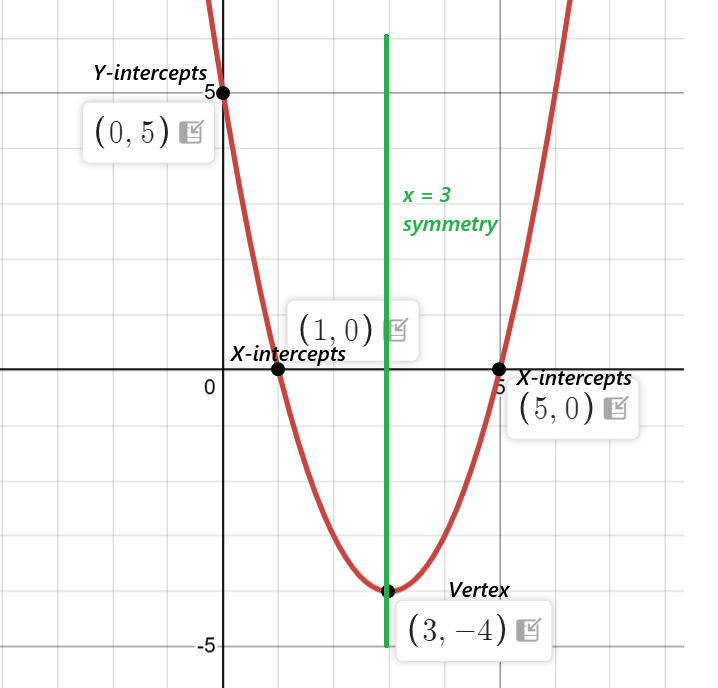
Example Consider the functions \( f(x) = (x – 3)^2 – 4 \) Define all the Key features of functions. ▶️Answer/ExplanationSolution: Graphing $f(x) = (x – 3)^2 – 4$ on any graphing calculator (e.g., Desmos, GDC):
Vertex at $(3, -4)$, Quadratic functions do not have asymptotes. |

\( \begin{aligned}
f(x) = g(x) &\Leftrightarrow (x – 3)^2 – 4 = x – 5 \Leftrightarrow x^2 – 6x + 9 – 4 = x – 5 \Leftrightarrow x^2 – 7x + 10 = 0 \\
&\Leftrightarrow x = 2 \text{ or } x = 5
\end{aligned} \)
By using either \( f(x) \) or \( g(x) \) we find \( y = -3 \), \( y = 0 \) respectively.
Hence, the curves intersect at points \( (2, -3) \) and \( (5, 0) \)
SOLVING EQUATIONS AND INEQUALITIES BY USING GRAPHS
We can solve equations of the form \( f(x) = g(x) \) inequalities of the form \( f(x) > g(x) \) or \( f(x) \geq g(x) \) by using GDC – graph mode
METHOD A: we find the intersection points of the graphs
\( \begin{aligned}
y_1 &= f(x) \\
y_2 &= g(x)
\end{aligned} \)
Solutions of \( f(x) = g(x) \): \( x \)-coordinates of intersection points
Solutions of \( f(x) > g(x) \): intervals where \( y_1 = f(x) \) is above \( y_2 = g(x) \)
METHOD B: we find the roots of the graph
\( y_1 = f(x) – g(x) \)
Solutions of \( f(x) – g(x) = 0 \): the roots of the graph
Solutions of \( f(x) – g(x) > 0 \): intervals where \( y_1 = f(x) – g(x) \) is positive
|
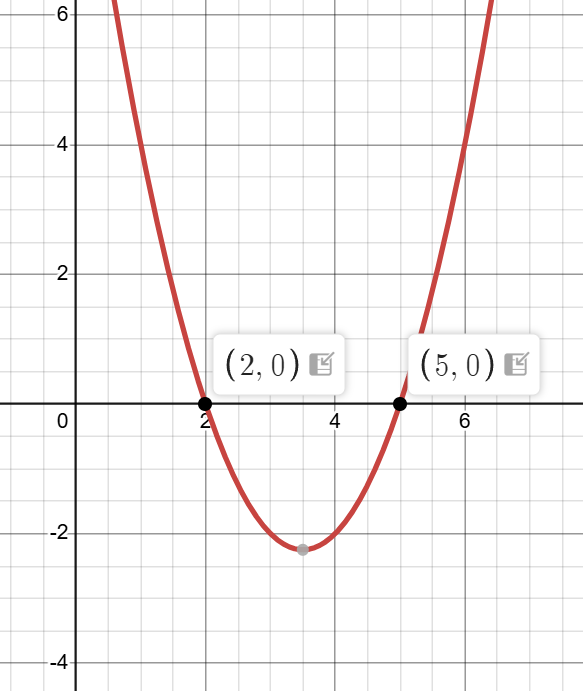
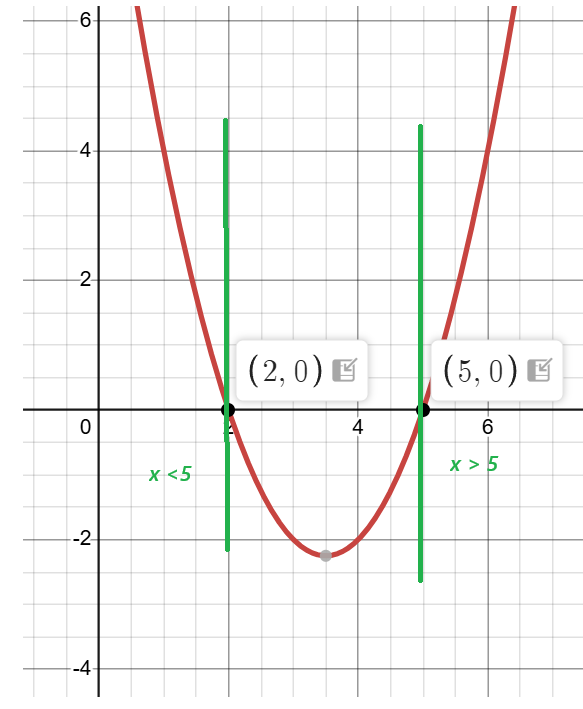
Example Consider \( f(x) = (x – 3)^2 – 4 \text{ and } g(x) = x – 5 \text{. } \) a) Solve the equation \( f(x) = g(x) \). b) Solve the inequality \( f(x) > g(x) \). ▶️Answer/ExplanationSolution: (a)METHOD A: Look at the graphs of \( y_1 = f(x) \) and \( y_2 = g(x) \) . The intersection points occur at \( x = 2 \), \( x = 5 \)
METHOD B: The equation can be written \( f(x) – g(x) = (x – 3)^2 – 4 – (x – 5) = 0 \) Look at the graph of \( y_1 = f(x) – g(x) \) (see GDC). Roots: \( x = 2 \), \( x = 5 \)
b)
|