The Graph of a Function; Equation \( y = f(x) \)
A function relates every input \( x \) to exactly one output \( y \).
It is commonly expressed as \( y = f(x) \), where:
\( x \): independent variable (input),
\( f(x) \): dependent variable (output).
Graphs visually represent how \( f(x) \) changes with \( x \).
Key Concept:
A graph passes the vertical line test if it’s a function.
Example \( f(x) = x^2 \). Sketch the graph of given function. Also discuss about vertex. ▶️Answer/ExplanationSolution: It’s a quadratic function.
Sketch description: Smooth U-shaped curve, symmetric about the y-axis. |

Sketching a Graph from Information or Context
What to include in your sketch:
Axes with labels and scale.
Important points:
x-intercepts: where \( f(x) = 0 \),
y-intercept: where \( x = 0 \),
Turning points (max/min),
Asymptotes (if applicable),
End behavior (what happens as \( x \to \infty \) or \( -\infty \)).
Sketching Tips:
Draw = use scale, ruler, accurate points.
Sketch = rough shape showing correct features.
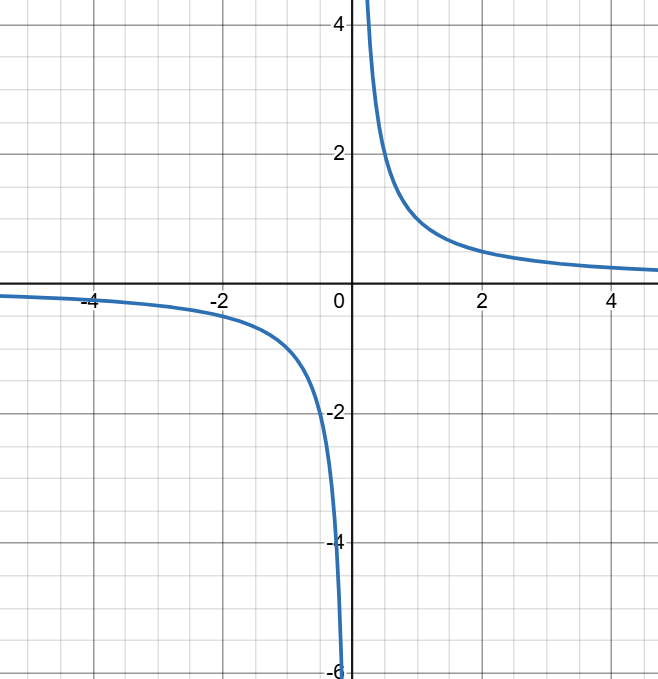
Example \( f(x) = \frac{1}{x} \) Sketch the graph of given function. Also discuss about Asymptotes ▶️Answer/ExplanationSolution:
Asymptotes: vertical at \( x = 0 \), horizontal at \( y = 0 \) Sketch description: Two curves approaching the axes but never touching. |

Using Technology to Graph Functions
Technology (e.g., Desmos, GeoGebra, GDC) is encouraged to:
Plot single functions like \( f(x) = 2x + 3 \)
Graph sums/differences: \( f(x) + g(x) \), \( f(x) – g(x) \)
Check your sketch against an accurate graph.
Example Let \( f(x) = x^2 \), \( g(x) = 2x \). Use a graphing calculator to plot: \( f(x) \) ▶️Answer/ExplanationSolution:
Graph Insight: The sum creates a new parabola shifted to the left. |


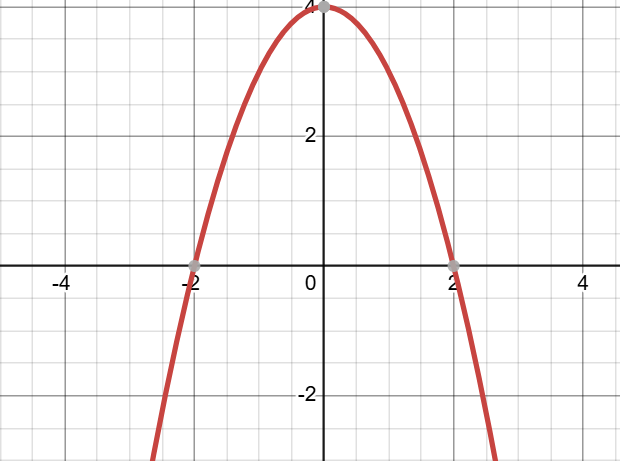
Example Sketch the graph of \( f(x) = -x^2 + 4 \) Label all key features. ▶️Answer/ExplanationSolution:
Vertex at (0, 4) |
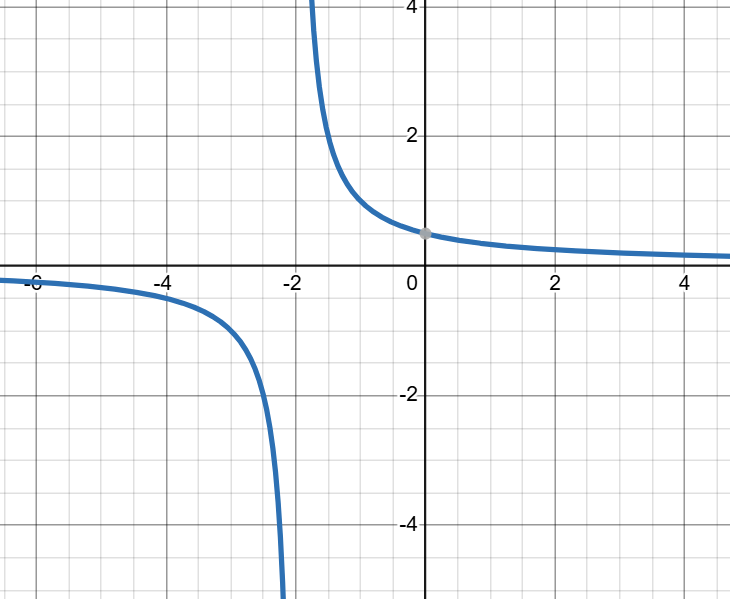
Example Use technology to graph \( f(x) = \frac{1}{x} \) and \( g(x) = \frac{1}{x+2} \). Describe the transformation. ▶️Answer/ExplanationSolution: Graph of $\frac{1}{x}$
Graph of $\frac{1}{x+2}$
\( g(x) \) is a horizontal shift of \( f(x) \) left by 2 units. |