Question
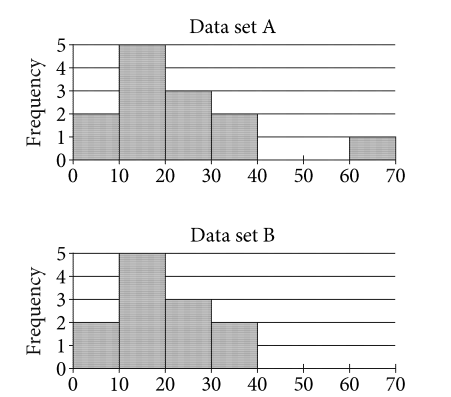
The two histograms show the distribution of data set A and data set B, respectively. Data set B is the result of removing the outlier from data set A. Which of the following statements about the means of data set A and data set B is true?
- The means of data set A and B are the same.
- The mean of data set A is greater than the mean of data set B.
- The mean of data set A is less than the mean of data set B.
- No comparison about the means of the data sets can be made.
Answer/Explanation
Ans: B
Question
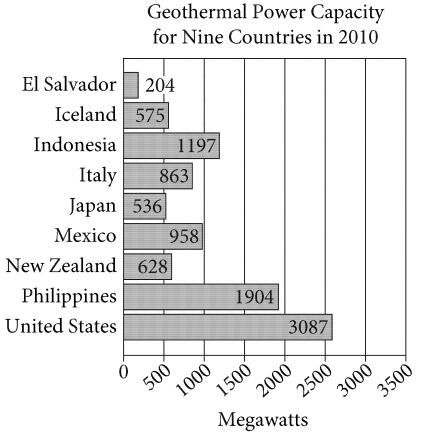
The graph shows the power capacity for the nine countries that had the greatest geothermal power capacity in 2010. What was the capacity, in megawatts, of the country that had the median capacity of the nine countries?
Answer/Explanation
Ans: 863
Question
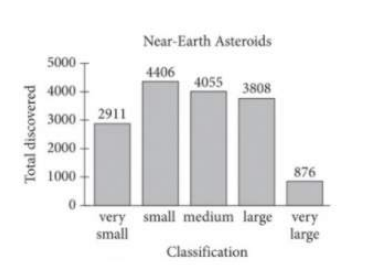
The bar graph shows the number of discovered near-Earth asteroids, by classification, as of April 2017 Of the near-Earth asteroids, how many more are classified as medium, large, or very large than are classified as very small or small?
Answer/Explanation
Ans: 1422
Question
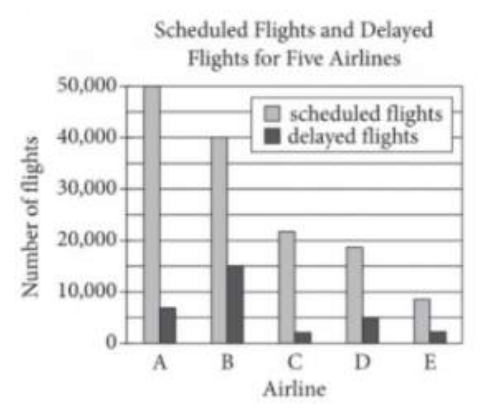
The bar graph above shows the total number of scheduled flights and the number of delayed flights for five airlines in a one-month period. Values have been rounded to the nearest 1000 flights.
According to the graph, what is the median number of delayed flights for the airlines shown?
Answer/Explanation
Ans: 5000
Question
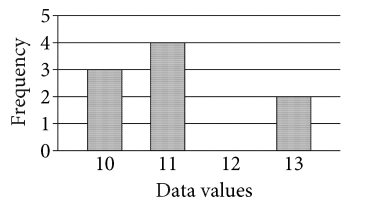
The bar graph shows the frequency of each data value in a certain data set. What is the minimum data value in the data set?
- 10
- 11
- 12
- 13
Answer/Explanation
Ans: A
Question
The histogram shows the distribution of book prices, in dollars, for the 27 books for sale at a store.

The first bar represents books with prices of less than \($\)5. The second bar represents books with prices of at least \($\)5 but less than \($\)10, and so on. In which interval will the median price of books for sale be included when the book that costs at least \($\)35 but less than \($\)40 is sold?
- At least \($\)0 but less than \($\)5
- At least \($\)5 but less than \($\)10
- At least \($\)10 but less than \($\)15
- At least \($\)35 but less than \($\)40
Answer/Explanation
Ans: B