Question
Consider the following reaction taking place at 375 °C in a \({\text{1.00 d}}{{\text{m}}^{\text{3}}}\) closed container.
\[\begin{array}{*{20}{l}} {{\text{C}}{{\text{l}}_{\text{2}}}{\text{(g)}} + {\text{S}}{{\text{O}}_{\text{2}}}{\text{(g)}} \rightleftharpoons {\text{S}}{{\text{O}}_{\text{2}}}{\text{C}}{{\text{l}}_{\text{2}}}{\text{(g)}}}&{\Delta {H^\Theta } = – 84.5{\text{ kJ}}} \end{array}\]
A solution of hydrogen peroxide, \({{\text{H}}_{\text{2}}}{{\text{O}}_{\text{2}}}\), is added to a solution of sodium iodide, NaI, acidified with hydrochloric acid, HCl. The yellow colour of the iodine, \({{\text{I}}_{\text{2}}}\), can be used to determine the rate of reaction.
\[{{\text{H}}_2}{{\text{O}}_2}{\text{(aq)}} + {\text{2NaI(aq)}} + {\text{2HCl(aq)}} \to {\text{2NaCl(aq)}} + {{\text{I}}_2}{\text{(aq)}} + {\text{2}}{{\text{H}}_2}{\text{O(l)}}\]
The experiment is repeated with some changes to the reaction conditions. For each of the changes that follow, predict, stating a reason, its effect on the rate of reaction.
Deduce the equilibrium constant expression, \({K_{\text{c}}}\), for the reaction.
If the temperature of the reaction is changed to 300 °C, predict, stating a reason in each case, whether the equilibrium concentration of \({\text{S}}{{\text{O}}_{\text{2}}}{\text{C}}{{\text{l}}_{\text{2}}}\) and the value of \({K_{\text{c}}}\) will increase or decrease.
If the volume of the container is changed to \({\text{1.50 d}}{{\text{m}}^{\text{3}}}\), predict, stating a reason in each case, how this will affect the equilibrium concentration of \({\text{S}}{{\text{O}}_{\text{2}}}{\text{C}}{{\text{l}}_{\text{2}}}\) and the value of \({K_{\text{c}}}\).
Suggest, stating a reason, how the addition of a catalyst at constant pressure and temperature will affect the equilibrium concentration of \({\text{S}}{{\text{O}}_{\text{2}}}{\text{C}}{{\text{l}}_{\text{2}}}\).
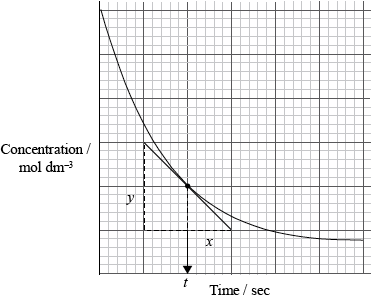
Graphing is an important method in the study of the rates of chemical reaction. Sketch a graph to show how the reactant concentration changes with time in a typical chemical reaction taking place in solution. Show how the rate of the reaction at a particular time can be determined.
The concentration of \({{\text{H}}_{\text{2}}}{{\text{O}}_{\text{2}}}\) is increased at constant temperature.
The solution of NaI is prepared from a fine powder instead of large crystals.
Explain why the rate of a reaction increases when the temperature of the system increases.
▶️Answer/Explanation
Markscheme
\(({K_{\text{c}}}) = \frac{{{\text{[S}}{{\text{O}}_2}{\text{C}}{{\text{l}}_2}{\text{]}}}}{{{\text{[C}}{{\text{l}}_2}{\text{][S}}{{\text{O}}_2}{\text{]}}}}\);
Ignore state symbols.
Square brackets [ ] required for the equilibrium expression.
value of \({K_{\text{c}}}\) increases;
\({\text{[S}}{{\text{O}}_2}{\text{C}}{{\text{l}}_2}{\text{]}}\) increases;
decrease in temperature favours (forward) reaction which is exothermic;
Do not allow ECF.
no effect on the value of \({K_{\text{c}}}\) / depends only on temperature;
\({\text{[S}}{{\text{O}}_2}{\text{C}}{{\text{l}}_2}{\text{]}}\) decreases;
increase in volume favours the reverse reaction which has more gaseous moles;
Do not allow ECF.
no effect;
catalyst increases the rate of forward and reverse reactions (equally) / catalyst decreases activation energies (equally);

labelled axes (including appropriate units);
correctly drawn curve;
correctly drawn tangent;
rate equal to slope/gradient of tangent (at given time) / rate \( = \frac{y}{x}\) at time \(t\);
[3 max] for straight line graph or graph showing product formation.
increases rate of reaction;
molecules (of \({{\text{H}}_2}{{\text{O}}_2}\)) collide more frequently / more collisions per unit time;
No ECF here.
no effect / (solution) remains unchanged;
solid NaI is not reacting / aqueous solution of NaI is reacting / surface area of NaI is not relevant in preparing the solution / OWTTE;
kinetic energy/speed of reacting molecules increases;
frequency of collisions increases per unit time;
greater proportion of molecules have energy greater than activation energy/\({E_{\text{a}}}\);
Accept more energetic collisions.
Examiners report
This was the most popular question in Section B and there was a generally pleasing level of performance. In (a)(i) most candidates were able to correctly deduce the equilibrium constant.
In (ii) most candidates realized the exothermic reaction would be favoured, and gained full marks for their explanation. However, some candidates seemed not to appreciate that the specified temperature of 300 °C was lower than the original, and so based their answers on a temperature increase.
In (iii) most forgot to mention the word gaseous when talking about the particles and many forgot that \({K_{\text{c}}}\) is only affected by temperature.
In (iv) candidates correctly stated that concentration would not change and stated that reaction rates of both forward and reverse reactions would be affected equally. However, some answered ‘the addition of a catalyst does not affect \({K_{\text{c}}}\) or the position of equilibrium’ which did not answer the question and scored no marks as they had not commented on the concentration of \({\text{SOC}}{{\text{l}}_{\text{2}}}\).
For (b), although most students were able to correctly sketch the reactant concentration / time graph by labeling the axes and drawing an appropriate curve, some candidates incorrectly read the question and sketched product / concentration time curve. Drawing a tangent to determine the rate was not well known and only some were able to describe how the rate at a particular instant could be determined from the tangent to the curve.
In (c), most scored the marks in (i) and were able to correctly describe the effect of concentration on rate in terms of collision theory, although some forgot to mention the frequency of the collisions just stating there would be more.
In part (ii), most candidates assumed that the rate would increase with surface area of the solute, and few realized that once the sodium iodide was in solution then the particle size of the solid used to make it was not relevant as it is the solution which reacts.
Part (d) was well answered but some candidates lost marks due to imprecise responses. For example it is the kinetic energy that increases with temperature, not energy. Also there were some errors such as the omission of the idea of frequency when referring to collisions and the belief that an increase in temperature caused a decrease in activation energy.
Question
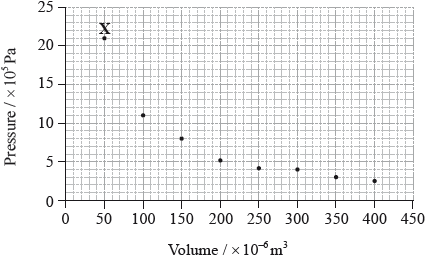
The graph below shows pressure and volume data collected for a sample of carbon dioxide gas at 330 K.

Draw a best-fit curve for the data on the graph.
Deduce the relationship between the pressure and volume of the sample of carbon dioxide gas.
Use the data point labelled X to determine the amount, in mol, of carbon dioxide gas in the sample.
▶️Answer/Explanation
Markscheme
smooth curve through the data;
Do not accept a curve that passes through all of the points or an answer that joins the points using lines.
inversely proportional / \({\text{V}}\alpha \frac{{\text{1}}}{{\text{p}}}\) / \({\text{P}}\alpha \frac{{\text{1}}}{{\text{V}}}\) ;
Accept inverse/negative correlation/relationship.
Do not accept \({\text{V}} = \frac{{\text{1}}}{{\text{p}}}\) / \({\text{P}} = \frac{{\text{1}}}{{\text{V}}}\) or descriptions like “one goes up as other goes down” / OWTTE.
\(p = 21 \times {10^5}/2.1 \times {10^6}{\text{ (Pa)}}/2.1 \times {10^3}{\text{ (kPa)}}\) and
\(V = 50 \times {10^{ – 6}}/5.0 \times {10^{ – 5}}{\text{ }}({{\text{m}}^3})/5.0 \times {10^{ – 2}}{\text{ }}({\text{d}}{{\text{m}}^3})\);
\(\left( {n = \frac{{pV}}{{RT}} = } \right){\text{ }}\frac{{2.1 \times {{10}^6} \times 5.0 \times {{10}^{ – 5}}}}{{8.31 \times 330}}\);
\(n = 0.038{\text{ (mol)}}\);
Award [3] for correct final answer.
For M3 apply ECF for correct computation of the equation the student has written, unless more than one mistake is made prior this point.
Examiners report
Almost all candidates gained the mark for drawing a best-fit curve through the data points on the graph, though some insisted in trying to put a straight line through obviously non-linear data. Many students identified the inverse proportionality of pressure and volume in Part (b), though the terminology often lacked precision. Most students could identify the correct equation to use in Part (c) in order to calculate the amount of gas from the specified data point, though quite often they had problems with units, either as a result of incorrectly reading the axis on the graph or as a result of conversion.
Almost all candidates gained the mark for drawing a best-fit curve through the data points on the graph, though some insisted in trying to put a straight line through obviously non-linear data. Many students identified the inverse proportionality of pressure and volume in Part (b), though the terminology often lacked precision. Most students could identify the correct equation to use in Part (c) in order to calculate the amount of gas from the specified data point, though quite often they had problems with units, either as a result of incorrectly reading the axis on the graph or as a result of conversion.
Almost all candidates gained the mark for drawing a best-fit curve through the data points on the graph, though some insisted in trying to put a straight line through obviously non-linear data. Many students identified the inverse proportionality of pressure and volume in Part (b), though the terminology often lacked precision. Most students could identify the correct equation to use in Part (c) in order to calculate the amount of gas from the specified data point, though quite often they had problems with units, either as a result of incorrectly reading the axis on the graph or as a result of conversion.
