Question
The graph below represents the relationship between two variables in a fixed amount of gas.
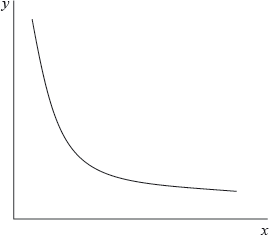
Which variables could be represented by each axis?
▶️Answer/Explanation
C
The given graph represents xy = constant i.e. hyperbola.
PV=nRT.
Since amount of gas is fixed, i.e. n is fixed. If temperature is also kept constant, this graph represents PV = constant.
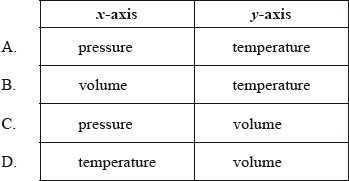
Question
What is the graphical relationship between n and T in the ideal gas equation, pV = nRT, all other variables remaining constant?

▶️Answer/Explanation
D
Here, nT = constant. Hyperbola as shown in option D is the correct answer.
Question
Graph 1 shows a plot of volume of CO2(g) against time for the reaction of CaCO3(s) with 1.00 moldm−3HCl (aq). The acid is the limiting reagent and entirely covers the lumps of CaCO3(s).
Which set of conditions is most likely to give the data plotted in graph 2 when the same mass of CaCO3(s) is reacted with the same volume of HCl(aq) at the same temperature?


▶️Answer/Explanation
C
At the same concentration of acid , (1.00 moldm−3HCl (aq) ), as size of lumps decreases, the surface area and number of solid particles of CaCO3(s) for the reaction increases, hence rate of reaction increases which means initial slope of graph increases and graph 2 can be formed.
Question
The rate of a reaction is studied at different temperatures.
Which is the best way to plot the data?
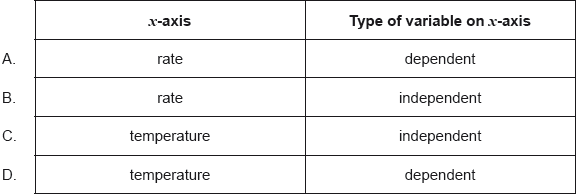
▶️Answer/Explanation
C
Since the rate of the reaction is studied at different temperatures, temperature is an independent variable and it is to be plotted on x axis with rate of reaction is a dependent variable plotted on the y axis.